Showing posts with label Monitoring. Show all posts

Nov 4, 2012

Zabbix poller processes more than 75% busy and queue delay (III)

Let's complete the last article about Zabbix poller processes more than 75% busy and queue delay. In this section, I am going to tackle the part of the client, that is, those things which can be modified on the agent so as to remove or attenuate the issues mentioned in the first article.

Remember that this is the continuation of the two previous articles:


First up, I changed the number of pre-forked instances of the Zabbix client which process passive checks (StartAgents) to 64. This parameter is really meaningful, because its default value is 5, that is to say, only five processes will be started in order to obtain the data requested by the server. So if you have a lot of items and a small monitoring period (as my case), you will need more processes to be able to attend all requests.

root@zabbix-client:~# cat /etc/zabbix/zabbix_agentd.conf
...
StartAgents=64

So let's see now in the graphs, how this change impacts on the results. Let's first with the Zabbix server performance.


And then, the Zabbix data gathering process.


As you can see on the first picture, the server has gone from a Zabbix queue of 30 to 0 (although you can observe 5 on the figure, think that the graph has been cut out). And on the second one, the Zabbix busy poller processes went from 24% to 0%.

Other parameters that you can play with are the number of seconds that the data can be stored in the buffer and its maximum number of values.

root@zabbix-client:~# cat /etc/zabbix/zabbix_agentd.conf
...
BufferSend=3600

BufferSize=65535

Also keep in mind that you should have a small value for the timeout (I am using five seconds on my installation).

Lastly, in order to solve the problem that I mentioned in the first article about from time to time, the processes break down and the zabbix agent is stopped, I developed a simple bash script to work around this issue.

root@zabbix-client:~# tail -f /var/log/zabbix/zabbix_agentd.log
...
zabbix_agentd [17271]: [file:'cpustat.c',line:155] lock failed: [22] Invalid argument
 17270:20121015:092010.216 One child process died (PID:17271,exitcode/signal:255). Exiting ...
...
 17270:20121015:092012.216 Zabbix Agent stopped. Zabbix 2.0.3 (revision 30485).


root@zabbix-client:~# cat /etc/zabbix/monitor_zabbix.sh
#!/bin/bash

while [ 1 ];
do
        if ! pgrep -f "/usr/local/sbin/zabbix_agentd -c /etc/zabbix/zabbix_agentd.conf" &> /dev/null ; then
                /etc/zabbix/zabbix.sh start
        fi
        sleep 15
done

This script is run in batch mode and takes care of monitoring the status of the agent processes and starting over when they drop . It uses another bash script to start and stop the agents.

root@zabbix-client:~# cat /etc/zabbix/zabbix.sh
#!/bin/bash

case $1 in
        "start")
                taskset -c $(($(cat /proc/cpuinfo | grep processor | wc -l) - 1)) /usr/local/sbin/zabbix_agentd -c /etc/zabbix/zabbix_agentd.conf;;
        "stop")
                pkill -f "/usr/local/sbin/zabbix_agentd -c /etc/zabbix/zabbix_agentd.conf";;
        *)
                printf "./zabbix.sh start|stop\n\n"
esac


Oct 28, 2012

Zabbix poller processes more than 75% busy and queue delay (II)

After putting forward the issues turned up on my current Zabbix installation and related to its performance (Zabbix poller processes more than 75% busy and queue delay), I am going to explain to you how I solved it.

First of all, I tried out to increase the number of pre-forked instances of pollers for the Zabbix server, that is, I changed its default value from 5 to 256 (remember that for that case, you have to set the the number of maximum connections in MySQL - max_connections - higher than 256, since every single poller opens a dedicated connection to the database).

root@zabbix-server:~# cat /etc/zabbix/zabbix_server.conf
...
# StartPollers=5
StartPollers=256

root@zabbix-server:~# cat /etc/mysql/my.cnf
...
max_connextions = 512

Below you can see the outcome after applying it (Zabbix server performance).


And the Zabbix data gathering process.


In the first figure, you can observe that the Zabbix queue has gone from 48 to 30 (approximately), and for the second one, the Zabbix busy poller processes went from 100% to 24%. So it is clear that if you have a server with enough resources, there is no problem to start many pollers. These kind of processes are responsible for requesting the data defined in the items, so the more pollers have available, the less overloaded the system is.

Other Zabbix server parameter that you ought to take into account is for example the Timeout (specifies how log pollers wait for agent responses). Try not to assign a very high value. Otherwise, the system might get overloaded.

Next week, I will end up this series of articles by accomplishing the part of the client.


Oct 15, 2012

Zabbix poller processes more than 75% busy and queue delay (I)

In my previous job, I had to set up a Zabbix infrastructure in order to monitor more than 400 devices between switches and servers. The main feature of this architecture was that there were a lot of machines, but the update interval was large (around 30 seconds) and the number of items small.

For this purpose, I wrote down a couple of articles related to this issue:


But in my current position, I am starting to introduce Zabbix (2.0.3 on Ubuntu Server 12.04) with the aim of controlling few devices where a large number of items and a small monitoring period are required. This situation leads to an overload of the Zabbix server, on the one hand by increasing the number of monitored elements delayed in the queue, and on the other, turning out that the poller processes are busy long.

In addition, I have been able to observe that, from time to time, the agent goes down in an unexpected way. If you take a look at the log file from the client (debug mode), the following error lines are dumped.

root@zabbix-client:~# tail -f /var/log/zabbix/zabbix_agentd.log
...
zabbix_agentd [17271]: [file:'cpustat.c',line:155] lock failed: [22] Invalid argument
 17270:20121015:092010.216 One child process died (PID:17271,exitcode/signal:255). Exiting ...
 17270:20121015:092010.216 zbx_on_exit() called
 17272:20121015:092010.216 Got signal [signal:15(SIGTERM),sender_pid:17270,sender_uid:0,reason:0]. Exiting ...
 17273:20121015:092010.216 Got signal [signal:15(SIGTERM),sender_pid:17270,sender_uid:0,reason:0]. Exiting ...
 17274:20121015:092010.216 Got signal [signal:15(SIGTERM),sender_pid:17270,sender_uid:0,reason:0]. Exiting ...
 17270:20121015:092012.216 Zabbix Agent stopped. Zabbix 2.0.3 (revision 30485).

Below you can observe a figure which shows the Zabbix server performance (queue) for the aforementioned case.


And the other one, reflects the Zabbix data gathering process (pay attention to the data Zabbix busy poller processes, in %).


For the first case, the Zabbix queue has averaged more than 50 monitored items delayed, and for the second one, the poller processes are busy about 100% of the time. This situation can produce that, sometimes, Zabbix draws sporadic dots rather than lines in the graphs. Another effect that you can get from this condition is that if you set a short update interval for an item, you could run into lack of data when you check the values gathered later.


Also say that I followed the tuning guide that I mentioned before, but as you can see, Zabbix server was acting up.


Sep 28, 2011

Zabbix client installation on Ubuntu

Through this article, I wanted to write down how to set up the Zabbix client from its source code on Ubuntu distributions. Some time ago I posted a similar article but utilizing a CentOS host. For this case, I am going to accomplish the same task but choosing an Ubuntu Server 11.04 and Zabbix 1.8.7.

First of all, we need to download the source code from the Zabbix web site and decompress it inside the server. We must have installed too the build-essential package, so as to be able to compile the Zabbix client.

root@ubuntu-server:~# aptitude install build-essential

root@ubuntu-server:~/zabbix-1.8.7# ./configure --enable-agent

root@ubuntu-server:~/zabbix-1.8.7# make ; make install

Once we have correctly compiled and installed the Zabbix agent, next step is to create the appropiate directories, copy the configuration files and add a new user to the system called zabbix.

root@ubuntu-server:~/zabbix-1.8.7# mkdir -p /etc/zabbix/alert.d /var/log/zabbix /var/run/zabbix

root@ubuntu-server:~/zabbix-1.8.7# cp -a misc/conf/zabbix_agentd.conf /etc/zabbix/

root@ubuntu-server:~/zabbix-1.8.7# cp misc/init.d/ubuntu/zabbix-agent.conf /etc/init/

root@ubuntu-server:~/zabbix-1.8.7# useradd -r -d /var/run/zabbix -s /sbin/nologin zabbix

root@ubuntu-server:~/zabbix-1.8.7# chown zabbix:zabbix /var/run/zabbix /var/log/zabbix

Afterwards, we must edit the minimum information required for the Zabbix agent configuration file and in addition, it is also neccesary to establish an Upstart file for starting up and stopping the Zabbix agent service.

root@ubuntu-server:~# cat /etc/zabbix/zabbix_agentd.conf
...
# Zabbix client PID file
PidFile=/var/run/zabbix/zabbix_agentd.pid

# Zabbix client log file
LogFile=/var/log/zabbix/zabbix_agentd.log

# Allow remote commands from zabbix server
EnableRemoteCommands=1

# Maximum time for processing
Timeout=10

# System hostname
Hostname=ubuntu

# Zabbix server IP
Server=192.168.1.100


root@ubuntu-server:~# cat /etc/init/zabbix-agent.conf
# Start zabbix agent

pre-start script
   if [ ! -d /var/run/zabbix ]; then
           mkdir -p /var/run/zabbix
           chown zabbix:zabbix /var/run/zabbix
   fi
end script

start on filesystem
stop on starting shutdown
respawn
expect daemon
exec /usr/local/sbin/zabbix_agentd

The last point is to register the ports used by Zabbix into the services file and run the agent.

root@ubuntu-server:~# echo "zabbix-agent    10050/tcp  Zabbix Agent"   >> /etc/services
root@ubuntu-server:~# echo "zabbix-agent    10050/udp  Zabbix Agent"   >> /etc/services
root@ubuntu-server:~# echo "zabbix-trapper  10051/tcp  Zabbix Trapper" >> /etc/services
root@ubuntu-server:~# echo "zabbix-trapper  10051/udp  Zabbix Trapper" >> /etc/services


root@ubuntu-server:~# start zabbix-agent


Sep 12, 2011

Monitoring logs with swatch

Swatch is a GPL tool programmed in Perl which allows monitoring logs on real-time, and it is aimed to be able to execute an action when a certain situation takes place.

An application can register an event into a file as a result of an error, warning, etc., and at that moment, it may be interesting to restart the involved service or for instance, to send an email reporting the alarm, all automatically.

Here is where swatch turns up. You have got two ways to install it: either by means of the package which each distribution keeps in its repositories or directly by compiling the source code.

In the case of Ubuntu, the installation is really simple: aptitude install swatch. But in RHEL or CentOS, the package is not available in the official repositories of such distributions.

Therefore, in the present article I am going to develop the installation of swatch (3.2.3) on CentOS 6.0 (32 bits, minimal installation) by downloading and installing the suitable packages from RPM PBone Search.

[root@centos tmp]# rpm -i perl-Carp-Clan-6.03-2.el6.noarch.rpm
[root@centos tmp]# rpm -i perl-Bit-Vector-7.1-2.el6.i686.rpm
[root@centos tmp]# rpm -i perl-Date-Calc-6.3-2.el6.noarch.rpm
[root@centos tmp]# rpm -i perl-Date-Manip-5.54-4.el6.noarch.rpm 
[root@centos tmp]# rpm -i perl-TimeDate-1.16-11.1.el6.noarch.rpm
[root@centos tmp]# rpm -i perl-Time-HiRes-1.9721-115.el6.i686.rpm
[root@centos tmp]# rpm -i perl-File-Tail-0.99.3-8.el6.noarch.rpm
[root@centos tmp]# rpm -i perl-Mail-Sendmail-0.79-12.el6.noarch.rpm

[root@centos tmp]# rpm -i swatch-3.2.3-2.el6.noarch.rpm

So that swatch can send alarms by email, you have to install some kind of MTA (Mail Transfer Agent) on your system, such as Postfix.

[root@centos ~]# yum install postfix

[root@centos ~]# cat /etc/postfix/main.cf
...
# Internet hostname
myhostname = centos.local

# Local Internet domain name
mydomain = local

# Domain that locally-posted mail appears to come from
myorigin = $myhostname

# Network interface addresses to receive mail
inet_interfaces = all

# List of domains to consider itself the final destination
mydestination = $myhostname, localhost.$mydomain, localhost, $mydomain
...

[root@centos ~]# service postfix restart

[root@centos ~]# chkconfig postfix on

Through the following example, we will control the /var/log/secure file in order to detect the login of the user javi (we must look for the string "Accepted password for javi").

First of all, we have to create a directory to drop off the configuration files of swatch. Afterwards, we must set up a file with the needed instructions to log the access for the user javi.

[root@centos ~]# mkdir /etc/swatch

[root@centos ~]# cat /etc/swatch/swatch.conf
watchfor /Accepted password for javi/
        mail addresses=root\@centos.local,subject="Session opened by javi"

With the previous line, swatch will monitor the content of a concrete file which will be later given with the target of matching the requested string. When the coincidental text is found, an email will be passed down.

So as to start swatch, we must run the next command ('-t' option comes from the traditional 'tail -f'). If instead of using '-t' parameter, you add '-f', swatch would execute the defined configuration once and then, close the file. In this manner, the file is not open as in the case of a typical 'tail -f'.

[root@centos ~]# swatch -c /etc/swatch/swatch.conf -t /var/log/secure

Swatch has got other many options for its configuration file, such as outputting the matched pattern, sending a bell, executing commands and so on. The following example watches for a couple of strings.

[root@centos ~]# cat /etc/swatch/swatch.conf
watchfor /Accepted password for javi|Accepted password for pepe/
    echo=red


Aug 1, 2011

Tuning Zabbix to improve its performance (II)

Let's continue with the last article about tuning Zabbix to improve its performance. First of all, I am going to set the suitable kernel parameters into the sysctl.conf file.

root@zbx01:~# cat /etc/sysctl.conf
...
# Maximum percentage of physical memory usage before going to swap
vm.swappiness = 10

# Number of open files for all processes
fs.file-max = 407020

# Minimum, default and maximum size of the send/receive buffer used by each TCP socket
net.ipv4.tcp_wmem = 8192        87380   16777216
net.ipv4.tcp_rmem = 8192        87380   16777216

# Maximum number of queued connection requests which have still not received an ACK (three-way handshake)
net.ipv4.tcp_max_syn_backlog = 2048

# Number of seconds to wait for a final FIN packet before the socket is forcibly closed
net.ipv4.tcp_fin_timeout = 25

# Number of seconds a connection needs to be idle before TCP begins sending out keep-alive probes
net.ipv4.tcp_keepalive_time = 1200

# Maximum TCP send window
net.core.wmem_max = 16777216

# Maximum TCP receive window
net.core.rmem_max = 16777216

# Maximum size in bytes of a message queue
kernel.msgmnb = 65536

# Maximum size for a message text
kernel.msgmax = 65536

# Maximum size in bytes for a shared memory segment
kernel.shmmax = 68719476736

# System wide maximum of shared memory pages
kernel.shmall = 4294967296

Then I am going to fit the values of MySQL by means of its configuration file. This part is really important if you want to achieve a good performance.

In order to adjust them, I have been following the status of the database throughout several weeks, by using tuning tools such as MySQL Performance Tuning Primer Script or MySQLTuner.

root@zbx01:~# cat /etc/mysql/my.cnf
...
# Size of the buffer used for index blocks
key_buffer = 16M

# Maximum size of one packet or any generated/intermediate string
max_allowed_packet = 16M

# Number of threads the server should cache for reuse
thread_cache_size = 64

# Maximum allowed number of simultaneous client connections
max_connections = 256

# Number of open tables for all threads
table_cache = 1024

# Number of table definitions that can be stored in the definition cache
table_definition_cache = 1024

# Do not cache results that are larger than this number of bytes
query_cache_limit = 16M

# Amount of memory allocated for caching query results
query_cache_size = 1024M

# Minimum size (in bytes) for blocks allocated by the query cache
query_cache_min_res_unit = 512

# 0: do not cache
# 1: cache all cacheable query results except for those that begin with SELECT SQL_NO_CACHE
# 2: cache results only for cacheable queries that begin with SELECT SQL_CACHE
query_cache_type = 1

# Slow queries are logged
log_slow_queries = /var/log/mysql/mysql-slow.log

# If a query takes longer than this value (seconds), the server logs the query
long_query_time = 5

# Queries that are expected to retrieve all rows are logged
log-queries-not-using-indexes

# Size in bytes of the memory buffer that InnoDB uses to cache data and indexes of its tables
innodb_buffer_pool_size = 4096M

With respect to MySQL, stand out that it is also important to defragment the query cache to enhance its utilization, by carrying out a "flush query cache" on the database. In my installation, I have seen that the optimum period is every hour.

root@zbx01:~# crontab -e
...
0 */1 * * * mysql -u root -pxxxxxx -e "flush query cache"

And finally, I have changed certain parameters from the Zabbix configuration file. The most important variable is related to the pre-forked pollers.

If this number is not enough, your Zabbix server will not be able to save all monitored data and you will find lack of many values. This is due to if the server runs out of sufficient processes to attend the requests, they will be ruled out and not registered.

root@zbx01:~# cat /etc/zabbix/zabbix_server.conf
...
# Number of pre-forked instances of pollers
StartPollers=96

# Shared memory size for storing hosts and items data
CacheSize=64M

# Shared memory size for storing history data
HistoryCacheSize=8M

# Shared memory size for storing trends data.
TrendCacheSize=8M

# Shared memory size for storing character, text or log history data
HistoryTextCacheSize=8M

Regarding Housekeeping, I have not modified any default parameter. In this way, the housekeeping procedure runs every hour and deletes all unnecessary values into the database.

If you note that your server does not work properly because it is using up lots of resources (CPU, memory, I/O) in this task, you will have to fit these options.

root@zbx01:~# cat /etc/zabbix/zabbix_server.conf
...
# Housekeeping is removing unnecessary information from history, alert, and alarm tables
# HousekeepingFrequency=1

# No more than MaxHousekeeperDelete rows will be deleted per one task in one housekeeping cycle
# MaxHousekeeperDelete=500

# Enable/disable housekeeping
# DisableHousekeeping=0


Jul 25, 2011

Tuning Zabbix to improve its performance (I)

I am really looking forward to this article. I think it is going to be really useful for Zabbix administrators.

When you have to control a small group of machines, it is enough to install Zabbix (either from the repositories or the source code) and not modify any parameter. But when the number of monitored machines or items is very large, it is necessary to fit some values related to the operating system, the database and the Zabbix itself. Otherwise it is possible that your system acts up or the performance is not expected.

Bellow you can see the status of my Zabbix server at work (Zabbix 1.8.5 with MySQL 5.1, on Ubuntu 11.04 - 64 bits). I am monitoring around 430 devices, between servers and switches, and you can distinguish that the requeried server performance (new values per second) is really huge: 1687.


This configuration would not be possible with a Zabbix base installation. Also point out the hardware features of the server: 4 vCPUs (2.66 GHz), 8 GB RAM and 254 GB of storage.

First of all, we are going to take a look at several graphics of the server. Let's get started with the memory consumption during a typical day. The figure shows that the average available memory is around 1.73 GB and the system is not swapping.


Regarding the CPU, I have chosen a period of 6 hours so as to explain the concept of Housekeeping in Zabbix. As you can make out in the next chart, the normal use of CPU is about 20-25%, but each hour, there is a strong increment. This situation coincides with a rise of the Input/Output operations.


The Housekeeping is a task run by Zabbix which takes care of removing the unnecessary data of the history, alerts and alarms tables. Taking a look at the zabbix log, you can find out how many records are deleted from the database.

root@zbx01:~# egrep 'housekeeper|Deleted' /var/log/zabbix/zabbix_server.log
1599:20110719:230307.692 Executing housekeeper
1599:20110719:231127.392 Deleted 1522478 records from history and trends
1599:20110720:001127.393 Executing housekeeper
1599:20110720:001927.742 Deleted 1480673 records from history and trends
...

This procedure is configured by means of different parameters into the zabbix_server.conf file.

Through the load average graph, we can also appreciate this issue, where the load average (1 min) reaches maximum increases of 1.30.


And finally, the following graphic represents the status of the Zabbix cache during a week. Its values are rightly suited too.


In the next article, I will teach how to set up correctly the parameters related to the Linux kernel, MySQL and Zabbix.


Jun 1, 2011

Zabbix server installation on Ubuntu (II)

We are going to conclude the last part of the Zabbix server installation on Ubuntu by setting up a new Apache web site for Zabbix.

root@ubuntu-server:~# cat /etc/apache2/sites-available/zabbix
<VirtualHost *:80>
Alias /zabbix /usr/share/zabbix
ErrorLog /var/log/apache2/zabbix-error.log
CustomLog /var/log/apache2/zabbix-access.log common
</VirtualHost>


root@ubuntu-server:~# a2dissite default

root@ubuntu-server:~# a2ensite zabbix

Besides it is also necessary to modify the PHP configuration file for adjusting it with the Zabbix requirements.

root@ubuntu-server:~# cat /etc/php5/apache2/php.ini
...
memory_limit = 256M

post_max_size = 32M

upload_max_filesize = 16M

max_execution_time = 600

max_input_time = 600

date.timezone = Europe/Madrid

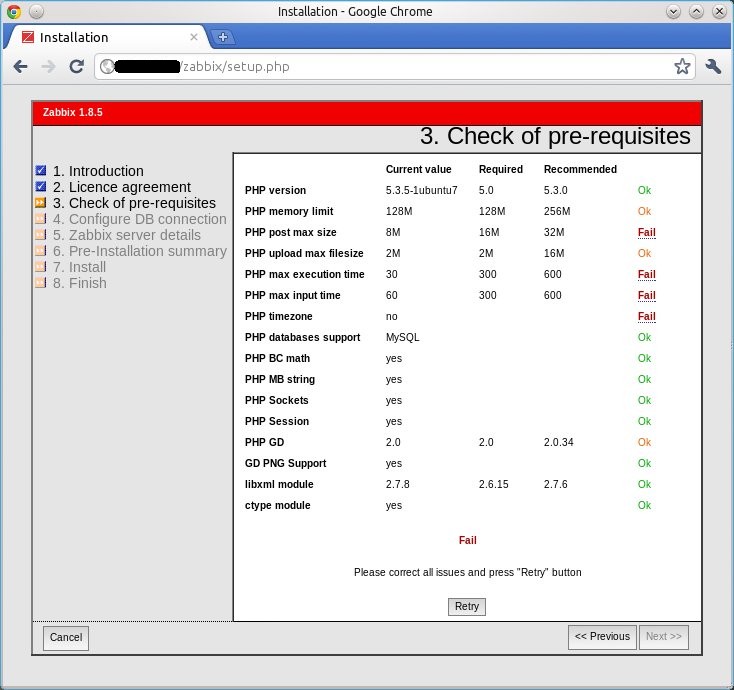
Finally, we have to open a web browser, point to the Zabbix URL (http://ubuntu-server/zabbix in my case) and fulfill the wizard. In the first screen, Zabbix checks the pre-requisites and warns us if something is wrong.


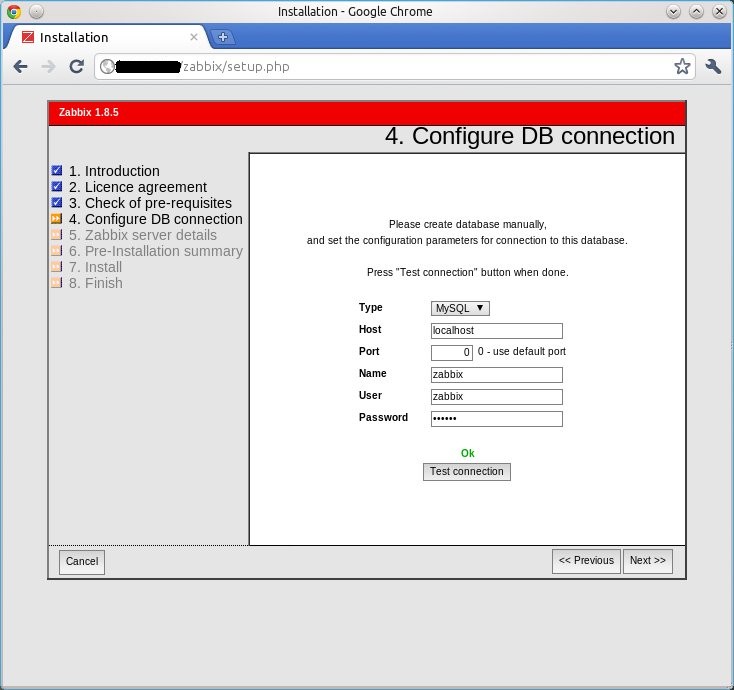
In the fourth step (Configure DB connection), we have to enter the configuration parameters for the database connection.


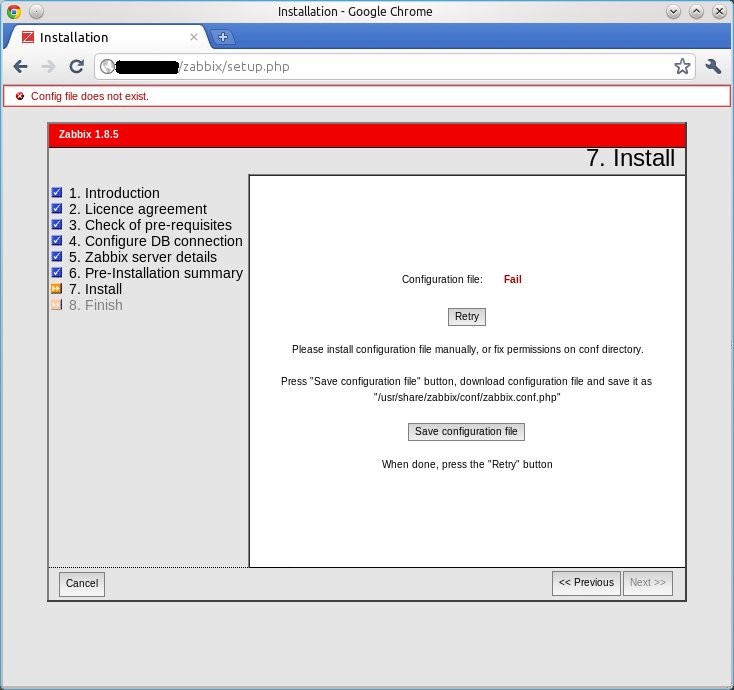
At the end of the wizard, we must download the Zabbix PHP configuration file (zabbix.conf.php) by clicking on the Save configuration file button.


Then we have to copy that file into the /usr/share/zabbix/conf directory and fix it the suitable permissions.

root@ubuntu-server:~# chmod 600 /usr/share/zabbix/conf/zabbix.conf.php

root@ubuntu-server:~# chown www-data:www-data /usr/share/zabbix/conf/zabbix.conf.php


May 14, 2011

Zabbix server installation on Ubuntu (I)

Some time ago I wrote an article about the installation of Zabbix server from its source code on CentOS.

Now I wanted to explain how to install it but this time, on Ubuntu. For my tests, I am going to use an Ubuntu Server 11.04 (64 bits) and Zabbix 1.8.5. For this infraestructure, we need MySQL and Apache. Let's start installing the necessary packages.

root@ubuntu-server:~# aptitude install build-essential apache2 mysql-server libmysqld-dev snmpd libsnmp-dev php5 php5-mysql php5-gd libcurl4-openssl-dev libiksemel-dev libopenipmi-dev libssh2-1-dev fping

root@ubuntu-server:~# mysql_secure_installation

As well it is important to run the mysql_secure_installation script in order to remove the anonymous user and the test database.

First of all we have to set up the database which will be used by Zabbix.

root@ubuntu-server:~# mysql -u root -p
...
mysql> CREATE DATABASE zabbix;
Query OK, 1 row affected (0.00 sec)

mysql> CREATE USER 'zabbix'@'localhost' IDENTIFIED BY 'xxxxxx';
Query OK, 0 rows affected (0.00 sec)

mysql> GRANT ALL PRIVILEGES ON zabbix.* TO 'zabbix'@'localhost';
Query OK, 0 rows affected (0.00 sec)

Once we have downloaded the Zabbix source code and decompressed it, we have just to compile and install it. If we want to have the Zabbix client, we must mark the --enable-agent parameter.

root@ubuntu-server:~/zabbix-1.8.5# ./configure --enable-agent  --enable-ipv6  --enable-server --with-mysql --with-libcurl --with-net-snmp --with-jabber --with-ssh2 --with-openipmi

root@ubuntu-server:~/zabbix-1.8.5# make ; make install

Next step is to create the needed directories and copy the configuration files into them. We must also add a new user (zabbix) to the system and dump the data and schemas within the Zabbix database.

root@ubuntu-server:~/zabbix-1.8.5# mkdir -p /etc/zabbix/alert.d /etc/zabbix/externalscripts /var/log/zabbix /var/run/zabbix /usr/share/zabbix

root@ubuntu-server:~/zabbix-1.8.5# useradd -r -d /var/run/zabbix -s /sbin/nologin zabbix

root@ubuntu-server:~/zabbix-1.8.5# cp -a misc/conf/zabbix_server.conf misc/conf/zabbix_agentd.conf /etc/zabbix/

root@ubuntu-server:~/zabbix-1.8.5# cp -r frontends/php/* /usr/share/zabbix

root@ubuntu-server:~/zabbix-1.8.5# chown zabbix:zabbix /var/run/zabbix /var/log/zabbix

root@ubuntu-server:~/zabbix-1.8.5# (echo "USE zabbix;" ; cat create/schema/mysql.sql ; cat create/data/data.sql ; cat create/data/images_mysql.sql) | mysql -h 127.0.0.1 -u zabbix --password=xxxxxx

Below we can see the minimum setting for both the server and client.

root@ubuntu-server:~# cat /etc/zabbix/zabbix_server.conf
...
# Zabbix server log file
LogFile=/var/log/zabbix/zabbix_server.log

# Zabbix server PID file
PidFile=/var/run/zabbix/zabbix_server.pid

# Zabbix database user and password
DBUser=zabbix
DBPassword=xxxxxx

# Location of alert scripts
AlertScriptsPath=/etc/zabbix/alert.d/

# Location of external scripts
ExternalScripts=/etc/zabbix/externalscripts


root@ubuntu-server:~# cat /etc/zabbix/zabbix_agentd.conf
...
# Zabbix client PID file
PidFile=/var/run/zabbix/zabbix_agentd.pid

# Zabbix client log file
LogFile=/var/log/zabbix/zabbix_agentd.log

# Allow remote commands from zabbix server
EnableRemoteCommands=1

# Maximum time for processing
Timeout=10

# System hostname
Hostname=ubuntu-server

# Zabbix server IP
Server=::ffff:127.0.0.1


root@ubuntu-server:~# chmod 600 /etc/zabbix/zabbix_server.conf

So as to be able to automatically start and stop the Zabbix agent and server, we have to create an Upstart file for this task. The Zabbix source code already provides the suitable script for Upstart, but I prefer to employ my own files (then you can see them - I have set some dependences which I consider important).

root@ubuntu-server:~# cat /etc/init/zabbix-server.conf
# Start zabbix server

pre-start script
if [ ! -d /var/run/zabbix ]; then
     mkdir -p /var/run/zabbix
     chown zabbix:zabbix /var/run/zabbix
fi
end script

start on started mysql
stop on stopping mysql
respawn
expect daemon
exec /usr/local/sbin/zabbix_server


root@ubuntu-server:~# cat /etc/init/zabbix-agent.conf
# Start zabbix agent

pre-start script
if [ ! -d /var/run/zabbix ]; then
     mkdir -p /var/run/zabbix
     chown zabbix:zabbix /var/run/zabbix
fi
end script

start on filesystem
stop on starting shutdown
respawn
expect daemon
exec /usr/local/sbin/zabbix_agentd

Now we can end the part of the Zabbix binary installation by registering the services and booting the processes up.

root@ubuntu-server:~# echo "zabbix-agent    10050/tcp  Zabbix Agent"   >> /etc/services
root@ubuntu-server:~# echo "zabbix-agent    10050/udp  Zabbix Agent"   >> /etc/services
root@ubuntu-server:~# echo "zabbix-trapper  10051/tcp  Zabbix Trapper" >> /etc/services
root@ubuntu-server:~# echo "zabbix-trapper  10051/udp  Zabbix Trapper" >> /etc/services


root@ubuntu-server:~# start zabbix-server

root@ubuntu-server:~# start zabbix-agent


Mar 12, 2011

System monitoring with nmon

Nmon is another interesting monitoring tool for Linux systems which can present many information related to the CPU, memory, network, etc. through an organized screen.

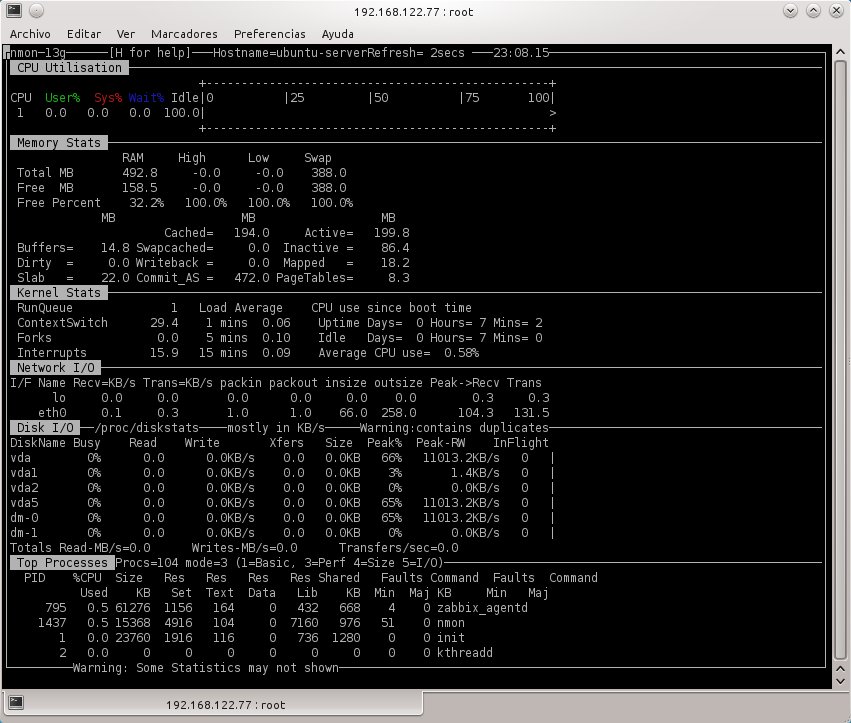
I have tested the 13g version on Ubuntu Server 10.10. When you start the application, this shows you a little menu with different options, in order to configure your own monitoring panel.

The next figure is a dump of my setting. I have used CPU utilization by processor, memory and swap stats, kernel stats and load average, network and disk input/output and top processes.


And finally, also say that with nmon you can take the data and dump them into a CSV file. For instance, in the following case I have run nmon in background to capture the data each 5 sg and a total of 200 times. Besides I have specified the file name with the '-F' option.

root@ubuntu-server:~# nmon -t -F `hostname`.csv -s 5 -c 200


Sep 13, 2010

System monitoring with top

Probably the most important tool for any Linux systems administrator is top, which has got an interface that provides a real time view of the main events that are happening in the system, such as CPU consumption, memory, processes state, etc.

[root@centos ~]# top
top - 11:29:56 up 53 min,  1 user,  load average: 0.16, 0.05, 0.05
Tasks: 136 total,   1 running, 135 sleeping,   0 stopped,   0 zombie
Cpu(s):  0.5%us,  0.6%sy,  0.0%ni, 98.2%id,  0.5%wa,  0.0%hi,  0.1%si,  0.0%st
Mem:   2059768k total,   352036k used,  1707732k free,    21248k buffers
Swap:  4095992k total,        0k used,  4095992k free,   207520k cached

PID USER      PR  NI  VIRT  RES  SHR S %CPU %MEM    TIME+  COMMAND
3057 root      15   0 12732 1004  716 R  2.0  0.0   0:00.01 top
1 root      15   0 10344  672  560 S  0.0  0.0   0:00.45 init
2 root      RT  -5     0    0    0 S  0.0  0.0   0:00.00 migration/0
3 root      34  19     0    0    0 S  0.0  0.0   0:00.00 ksoftirqd/0
4 root      RT  -5     0    0    0 S  0.0  0.0   0:00.00 watchdog/0
5 root      10  -5     0    0    0 S  0.0  0.0   0:04.19 events/0
6 root      10  -5     0    0    0 S  0.0  0.0   0:00.00 khelper
23 root      10  -5     0    0    0 S  0.0  0.0   0:00.00 kthread
27 root      10  -5     0    0    0 S  0.0  0.0   0:00.00 kblockd/0
28 root      20  -5     0    0    0 S  0.0  0.0   0:00.00 kacpid
85 root      20  -5     0    0    0 S  0.0  0.0   0:00.00 cqueue/0
88 root      20  -5     0    0    0 S  0.0  0.0   0:00.00 khubd
90 root      10  -5     0    0    0 S  0.0  0.0   0:00.00 kseriod
154 root      25   0     0    0    0 S  0.0  0.0   0:00.00 pdflush
155 root      15   0     0    0    0 S  0.0  0.0   0:00.03 pdflush
156 root      20  -5     0    0    0 S  0.0  0.0   0:00.00 kswapd0
157 root      20  -5     0    0    0 S  0.0  0.0   0:00.00 aio/0
298 root      11  -5     0    0    0 S  0.0  0.0   0:00.00 kpsmoused
...

We have a first line where the two most important data are the time that the machine is on (11:29:56 up) and the average number of system processes (load average) which have been waiting for any system resource (CPU, disk access, network, etc.) during the last 1, 5 and 15 minutes.

Then there is a data block where are showed the overall features of the system:

Tasks indicates the processes number which are up, where some of them will be able to be in running, sleeping, stopped or zombie state.

Cpu(s) shows the CPU use, by both the user (%us) and the system (%sy), as well as the percentage of CPU idle (%id).

Mem indicates the distribution which is being done of the RAM memory, offering the total amount available (total), the memory currently in use (used), the free memory (free), the buffers used (buffers) and within the total memory used, how much is cached (cached).

Swap shows the distribution of swap memory, providing the total amount available (total) and the part which is being used (used).

The other block of information presented by top is a set of columns with information about each process.

  • PID: process ID number.

  • USER: user name who has run the process.

  • PR: process priority.

  • NI: process priority change.

  • VIRT: amount of virtual memory for process (including all code, data and shared libraries - if you have N instances of the same program running at the same time, the context of the application will be only once in memory). VIRT = SWAP + RES.

  • RES: total physical memory (RAM) used by the process.

  • SHR: amount of memory that can be shared with other processes.

  • S: process status; D (sleeping and interruptible), S (sleeping), T (stopped) and Z (zombie).

  • %CPU: percentage of CPU usage.

  • %MEM: percentage of physical memory usage.

  • TIME+: total CPU time used by the process.

  • COMMAND: application which has run the process.

There are other fields associated with the tasks which are not displayed by default by top. If you want to view them, first you must press the 'f' key in order to see all available fields, and then press the key associated with the field to be added (e.g. 'p' key for SWAP).

Also say that the column values displayed by top can be ordered according to the memory (shift + m), PID (shift + n), CPU (shift + p) and the total CPU time used by the process (shift + t).

Finally also say that sometimes we can get that almost all physical memory is in use, but to sort the processes by memory, do not add the total amount of memory used. At this moment we will must look at the cached field, since in this way we will be able to see that the operating system is caching part of that memory, and the fact that a system caches memory is really the optimal situation.


Aug 30, 2010

SNMP basic commands

In this article we are going to see the main SNMP commands that are provided by the net-snmp and net-snmp-utils packages.

The MIBs used by these tools normally reside in the /usr/share/snmp/mibs/ directory. Therefore, if we have ever to install new MIBs (e.g. for a VMware ESXi) we will have to leave them into that directory.

[root@centos ~]# ls -l /usr/share/snmp/mibs/
total 2364
...
-r--r--r-- 1 root root   8259 feb 16 12:09 SNMPv2-CONF.mib
-rw-r--r-- 1 root root   8263 feb 16 11:19 SNMPv2-CONF.txt
-r--r--r-- 1 root root  31588 feb 16 12:09 SNMPv2-MIB.mib
-rw-r--r-- 1 root root  29305 feb 16 11:19 SNMPv2-MIB.txt


snmpget

The snmpget command provides information about a specific OID.

For instance, to request the name of the device (system.sysName OID, belonging to the SNMPv2-MIB module) we will run the following order:

[root@centos ~]# snmpget -v 2c -c centos-community 192.168.1.10 SNMPv2-MIB::system.sysName.0
SNMPv2-MIB::sysName.0 = STRING: centos

We can also use abbreviations as follows:

[root@centos ~]# snmpget -v 2c -c centos-community 192.168.1.10 system.sysName.0
SNMPv2-MIB::sysName.0 = STRING: centos

[root@centos ~]# snmpget -v 2c -c centos-community 192.168.1.10 sysName.0
SNMPv2-MIB::sysName.0 = STRING: centos

Also say that multiple queries and use the OID in numeric format can be done.

[root@centos ~]# snmpget -v 2c -c centos-community 192.168.1.10 sysName.0 sysUpTime.0
SNMPv2-MIB::sysName.0 = STRING: centos
DISMAN-EVENT-MIB::sysUpTimeInstance = Timeticks: (69808) 0:11:38

[root@centos ~]# snmpget -v 2c -c centos-community 192.168.1.10 .1.3.6.1.2.1.1.5.0
SNMPv2-MIB::sysName.0 = STRING: centos


snmptranslate

The snmptranslate command allows to make translations of OIDs from numeric format to variable and vice versa.

[root@centos ~]# snmptranslate .1.3.6.1.2.1.2.2.1.4.2
IF-MIB::ifMtu.2

[root@centos ~]# snmptranslate -On IF-MIB::ifMtu.2
.1.3.6.1.2.1.2.2.1.4.2

In order to get the complete OID, we must use the -Of parameter.

[root@centos ~]# snmptranslate -Of IF-MIB::ifMtu.2
.iso.org.dod.internet.mgmt.mib-2.interfaces.ifTable.ifEntry

For example it can happend that we don't remember the complete OID name. In this case, the -Ib parameter will provide us the best match.

[root@centos ~]# snmptranslate -Ib 'i*tu'
IF-MIB::ifMtu

But if we want to get all the matches that fit with the selected pattern, we will use the -TB option.

[root@centos ~]# snmptranslate -TB 'sys.*ime'
SNMPv2-MIB::sysORUpTime
SNMPv2-MIB::sysUpTime
DISMAN-EVENT-MIB::sysUpTimeInstance
IP-MIB::ipSystemStatsDiscontinuityTime

Finally, also say that the snmptranslate command is very useful to show the entire OIDs tree or all branches that hang of a particular OID.

[root@centos ~]# snmptranslate -Tp -IR | more
+--iso(1)                    
|
+--org(3)
|
+--dod(6)
|
+--internet(1)
...

[root@centos ~]# snmptranslate -Tp -IR system
+--system(1)
|
+-- -R-- String    sysDescr(1)
|        Textual Convention: DisplayString
|        Size: 0..255
+-- -R-- ObjID     sysObjectID(2)
+-- -R-- TimeTicks sysUpTime(3)
|  |
|  +--sysUpTimeInstance(0)
...


snmpwalk

The snmpwalk command is utilized to perform a series of followed GETNEXTS instructions, and thus to obtain for example all the values of a specific branch.

[root@centos ~]# snmpwalk -v 2c -c centos-community 192.168.1.10 system
SNMPv2-MIB::sysDescr.0 = STRING: Linux server 2.6.18-164.11.1.el5 #1 SMP Wed Jan 20 07:32:21 EST 2010 x86_64
SNMPv2-MIB::sysObjectID.0 = OID: NET-SNMP-MIB::netSnmpAgentOIDs.10
DISMAN-EVENT-MIB::sysUpTimeInstance = Timeticks: (342908) 0:57:09.08
SNMPv2-MIB::sysContact.0 = STRING: Root  (configure /etc/snmp/snmp.local.conf)
SNMPv2-MIB::sysName.0 = STRING: centos
...


Aug 16, 2010

Instalación y configuración de SNMP

En el presente artículo vamos a ver cómo configurar el servicio SNMP en una distribución CentOS 5.5 de 64 bits.

Lo primero que haremos será instalar los paquetes necesarios en el sistema:
[root@centos ~]# yum install net-snmp net-snmp-utils

A continuación definiremos las ACL (Access Control Lists) o listas de control de acceso dentro del fichero de configuración del demonio (snmpd.conf), a través de las cuáles indicaremos quién podrá conectarse al servicio SNMP y con qué permisos.

Básicamente vamos a crear dos ACLs, local y mynetwork, ambas pertenecientes a la comunidad centos-community. La primera de ellas tendrá permisos de lectura y escritura sobre las ramas de OIDs, y la segunda de ellas, únicamente permisos de lectura.

[root@centos ~]# cat /etc/snmp/snmpd.conf
...
com2sec local 127.0.0.1/32 centos-community
com2sec mynetwork 192.168.1.0/8 centos-community

A continuación crearemos dos grupos, uno de sólo lectura (MyROGroup) y otro de lectura/escritura (MyRWGroup) que podrán utilizar cualquier versión del protocolo SNMP (any).

[root@centos ~]# cat /etc/snmp/snmpd.conf
...
group MyROGroup any mynetwork
group MyRWGroup any local

access MyROGroup "" any noauth exact all none none
access MyRWGroup "" any noauth exact all all all

Y por último, definiremos las ramas que permitiremos visualizar.

[root@centos ~]# cat /etc/snmp/snmpd.conf
...
view all included .1

Ahora sólo tendremos que reiniciar el servicio y hacer que éste se inicie automáticamente cada vez que arranque el sistema.

[root@centos ~]# service snmpd restart

[root@centos ~]# chkconfig snmpd on

Para comprobar que todo funciona correctamente, podremos hacer la prueba de listar la estructura de system.

[root@centos ~]# snmpwalk -v 2c localhost -c centos-community system


Jul 20, 2010

Scripts internos en Zabbix

Uno de los puntos fuertes de Zabbix es que a través de los agentes podemos ejecutar comandos o scripts dentro de los huéspedes o máquinas monitorizadas.

A diferencia de los scripts externos que son ejecutados por el servidor de Zabbix, los scripts internos serán lanzados por el propio agente dentro de la máquina monitorizada.

Vamos a mostrar un ejemplo sencillo, en donde un agente ejecutará periódicamente (cada 30 sg) un script encargado de volcar en un fichero (/tmp/file) el espacio ocupado por el directorio /etc. Este script devolverá el resultado de la operación (variable $?). Las pruebas serán realizadas en un CentOS 5.4 de 64 bits con Zabbix 1.8.1.

Lo primero que haremos será crear un directorio dentro del árbol de Zabbix para ubicar posteriormente nuestro script (script.sh).

[root@centos ~]# mkdir -p /etc/zabbix/internalscripts/

[root@centos ~]# vim /etc/zabbix/internalscripts/script.sh
#!/bin/bash
du -shx /etc >> /tmp/file
echo $?

[root@centos ~]# chown -R zabbix:zabbix /etc/zabbix/internalscripts

[root@centos ~]# chmod 700 /etc/zabbix/internalscripts/script.sh

Después tendremos que editar el fichero de configuración del agente de Zabbix habilitando la posibilidad de ejecutar comandos remotos.

[root@centos ~]# cat /etc/zabbix/zabbix_agentd.conf
...
# Nombre del host (salida del comando hostname)
Hostname=centos.local

EnableRemoteCommands=1

[root@centos ~]# service zabbix-agent restart

Ahora ya podremos crear un item (desde el interfaz web de Zabbix) que utilice el script creado. Le llamaremos por ejemplo "script interno".


En la figura anterior puede verse que dicho item deberá ser de tipo Zabbix agent (active), y como clave (key) utilizaremos la función system.run para ejecutar el script. El script devolverá un número entero decimal (0 en caso de éxito y 1 en caso contrario); por lo tanto escogeremos como tipo de información Numeric (unsigned).

Un error típico que suele cometer la gente al crear un item de esta naturaleza consiste en establecer un tipo retornado incorrecto. Para el caso anterior hemos dicho que se trataba de un valor entero decimal. Si en dicho script no hubiésemos puesto la línea "echo $?", al poco tiempo de activar el item éste se hubiera deshabilitado, obteniendo un estado con el mensaje Not supported.

Analizando el log del agente de Zabbix hubiéramos visto una línea como la siguiente:

[root@centos ~]# tail -f /var/log/zabbix-agent/zabbix_agentd.log
...
796:20100629:174748.005 Active check [system.run[/etc/zabbix/internalscripts/script.sh]] is not supported. Disabled.


Jul 5, 2010

Instalación del cliente Zabbix a partir del código fuente

En uno de los artículos anteriores vimos la forma de instalar el servidor de Zabbix desde su propio código fuente. En el presente artículo vamos a desarrollar la instalación del cliente Zabbix (1.8.2) en una máquina RHEL 5.5 de 32 bits.

Vamos a comenzar instalando en nuestro sistema el compilador gcc, necesario para generar el binario del cliente de Zabbix.

[root@rhel ~]# yum install -y gcc

A continuación descargaremos el código fuente de Zabbix, lo descomprimiremos y seguidamente lo compilaremos, generando los binarios correspondientes.

[root@rhel ~]# wget http://downloads.sourceforge.net/project/zabbix/ZABBIX%20Latest%20Stable/1.8.2/zabbix-1.8.2.tar.gz?use_mirror=freefr

[root@rhel ~]# tar xvzf zabbix-1.8.2.tar.gz ; cd zabbix-1.8.2

[root@rhel zabbix-1.8.2]# ./configure --enable-agent

[root@rhel zabbix-1.8.2]# make ; make install

Si hubiéramos querido obtener un binario que incluyera las librerías de forma estática, tendríamos que haber añadido la opción --enable-static al script configure.

El siguiente paso consistirá en crear todos los directorios necesarios para Zabbix, añadir un usuario denominado zabbix al sistema y copiar los archivos de arranque y configuración a sus respectivos directorios.

[root@rhel zabbix-1.8.2]# mkdir -p /etc/zabbix/alert.d /var/log/zabbix-agent /var/run/zabbix-agent

[root@rhel zabbix-1.8.2]# adduser -r -d /var/run/zabbix-agent -s /sbin/nologin zabbix

[root@rhel zabbix-1.8.2]# cp -a misc/conf/zabbix_agentd.conf /etc/zabbix

[root@rhel zabbix-1.8.2]# cp -a misc/init.d/redhat/8.0/zabbix_agentd /etc/init.d

[root@rhel zabbix-1.8.2]# chown -R zabbix:zabbix /var/run/zabbix* /var/log/zabbix* /etc/zabbix

[root@rhel zabbix-1.8.2]# chown root:root /etc/init.d/zabbix_agentd

Una vez copiados los ficheros, modificaremos ciertos parámetros que por defecto vienen establecidos en dichos archivos.

[root@rhel zabbix-1.8.2]# cat /etc/zabbix/zabbix_agentd.conf
...
# Nombre del archivo de log
LogFile=/var/log/zabbix-agent/zabbix_agentd.log

# Habilitar el uso de comandos remotos
EnableRemoteCommands=1

# Número máximo de segundos para el procesamiento
Timeout=10

# Nombre del host (salida del comando hostname)
Hostname=rhel.local

# Dirección IP del servidor Zabbix
Server=192.168.1.10


[root@rhel zabbix-1.8.2]# cat /etc/init.d/zabbix_agentd
# Ubicación del binario
progdir="/usr/local/sbin/"

# Retardo de 5 sg para el reinicio
...
restart() {
stop
sleep 5
start
...

En el fichero /etc/services definiremos los servicios para el agente de Zabbix.

[root@rhel ~]# echo "zabbix-agent    10050/tcp  Zabbix Agent"   >> /etc/services
[root@rhel ~]# echo "zabbix-trapper 10051/tcp Zabbix Trapper" >> /etc/services

Ahora sólo nos quedará por iniciar el agente y hacer que éste se inicie automáticamente al arrancar el sistema.

[root@rhel ~]# chkconfig zabbix_agentd on

[root@rhel ~]# chmod +x /etc/init.d/zabbix_agentd

[root@rhel ~]# service zabbix_agentd start

En caso de querer utilizar SELinux, recomiendo tenerlo activado (Enforcing) durante todo el proceso de instalación del cliente, ya que la primera vez que configuré el cliente de Zabbix tenía desabilitado SELinux (disabled), y al volver a reiniciar el sistema con SELinux activado (enforcing), tuve varios problemas.

Jun 28, 2010

Activar SNMP en VMware ESXi

En la versión 4.0 de VMware ESXi, el protocolo SNMP viene deshabilitado por defecto. Por lo tanto, no tendremos activado en la máquina ningún agente SNMP al cual le podamos realizar consultas o nos informe de ciertos eventos a través de traps.

Para activar el protocolo SNMP tendremos que conectarnos al VMware ESXi mediante SSH (service console) y editar el fichero snmp.xml con la siguiente configuración:

~ # cat /etc/vmware/snmp.xml
<config>
<snmpSettings>
<enable>true</enable>
<communities>public</communities>
<targets>192.168.1.150@161 public</targets>
</snmpSettings>
</config>

~ # /sbin/services.sh restart

En dicho fichero de configuración hemos definido una comunidad denominada public y una dirección IP que podrá realizar consultas. Por último, hemos reiniciado los servicios.

Para comprobar que funciona correctamente, solicitaremos el árbol de OIDs al VMware ESXi desde nuestra máquina Linux (target).

[root@centos ~]# snmpwalk -v 2c -c public 192.168.1.10
SNMPv2-MIB::sysDescr.0 = STRING: VMware ESX 4.0.0 build-219382 VMware, Inc. x86_64
SNMPv2-MIB::sysObjectID.0 = OID: SNMPv2-SMI::enterprises.6876.4.1
DISMAN-EVENT-MIB::sysUpTimeInstance = Timeticks: (5672) 0:00:56.72
SNMPv2-MIB::sysContact.0 = STRING: not set
SNMPv2-MIB::sysName.0 = STRING: esxi.local
...

May 3, 2010

Monitorización remota de logs con Zabbix

Otra de las muchas posibilidades que nos ofrece Zabbix de cara a la monitorización remota de una máquina, es la posibilidad de controlar también los logs (o cualquier tipo de fichero de texto) de esta última.

El único requerimiento es tener un agente de Zabbix instalado y funcionando en modo activo (comportamiento por defecto del cliente) en el equipo que se desee monitorizar. En el modo pasivo, el cliente lo único que hace es escuchar las peticiones del servidor. Por lo tanto, si queremos que el agente monitorice un log e informe al servidor cuando haya encontrado alguna determinada cadena de texto, el único requisito consistirá en estar en modo activo.

Para desactivar el modo activo (pasar a modo pasivo), lo único que hay que hacer es añadir la siguiente línea al fichero de configuración del cliente:

[root@server ~]# cat /etc/zabbix/zabbix_agentd.conf
...
DisableActive=1

Otra cosa que también conviene tener en cuenta para que esto funcione correctamente es que el nombre definido en el parámetro Hostname (dentro del fichero de configuración del cliente), debe coincidir con el nombre dado al equipo a la hora de configurarlo desde el frontal web de Zabbix (campo Name de la pantalla CONFIGURATION OF HOSTS).

[root@server ~]# cat /etc/zabbix/zabbix_agentd.conf
...
Hostname=server

A continuación vamos a mostrar un ejemplo de monitorización remota de un fichero: vamos a controlar el archivo /var/log/messages del propio servidor de Zabbix, con el objetivo de que nos envíe las líneas de texto que contengan la palabra "error".

Recordar que tendremos que asegurarnos que el usuario zabbix puede leer ese fichero...

[root@server ~]# ls -l /var/log/messages
-rw----r-- 1 root root 160 abr 22 16:48 /var/log/messages

Lo primero que vamos a hacer es crear un item de tipo Zabbix agent (active), el cual retornará un valor de tipo Log. La frecuencia de muestreo (Update interval) la estableceremos en 30 sg.


A continuación vamos a definir un trigger asociado a este item, el cual se encargará de generar una alarma de severidad alta en caso de recibir una línea de error correspondiente al fichero messages.

Dentro del trigger utilizaremos la función nodata(sec), la cual recibirá como argumento un número entero que se corresponderá con un valor en segundos, y donde devolverá un '1' en caso de no haber recibido ninguna línea monitorizada (en nuestro caso, una línea que contenga la palabra "error") durante los últimos segundos definidos en el parámetro sec, o un '0' en caso contrario.

Por lo tanto, nuestro trigger generará una alarma si durante los últimos 30 últimos segundos le ha llegado alguna línea de error.


Otra posibilidad hubiese consistido en enviar todo el fichero messages desde el cliente al servidor. Para ello tendríamos que haber empleado un item con la siguiente clave: log["/var/log/messages"].

La única diferencia con respecto al item anterior es que ahora no le estamos indicando al cliente de Zabbix que envíe al servidor sólo las líneas que contengan la palabra "error", por lo tanto el cliente enviará todo el contenido del fichero a medida que se vaya escribiendo sobre él.

Para esta segunda posibilidad tendríamos que haber empleado en vez de la función nodata, la función regexp, pasándole como argumento la cadena de texto "error". De esta forma generaríamos una alarma cuando dentro de todo el contenido del fichero enviado, se detectara exclusivamente la palabra "error". La expresión del trigger hubiese quedado de la siguiente forma: {server:log["/var/log/messages","error"].regexp(error)}=1.

Este segundo métodos tiene un inconveniente muy grave: estamos enviando todo el fichero a través de la red, con lo que la estamos sobrecargando mandando información no necesaria.

Además para este segundo caso, tendríamos que seleccionar la opción Normal + Multiple TRUE events dentro del campo Event generation, con el objetivo de permitir que se pudieran lanzar múltiples alarmas para el mismo trigger, ya que por ejemplo se podría generar una alarma, pasar una hora y que no se recibiera ningún tipo de información a través del item, y que al cabo de esa hora volviese a llegar otra cadena de texto que se correspondiera con el error. Para este último caso no se generaría la alarma al tener seleccionada una generación de eventos de tipo Normal.

Para el primer ejemplo nos vale con la opción Normal, ya que aunque se generase una alarma, al cabo de 30 sg desaparecería, con lo que a partir de ese tiempo podría llegar otra alarma de la misma clase (cadena "error").

Y ya por último, decir también que si queremos monitorizar un fichero cuyo nombre varía (por ejemplo un log que rota de nombre), podemos emplear en lugar de la función log, la función logrt, la cual sí que acepta la inclusión de expresiones regulares dentro de su primer argumento (nombre del fichero).

Si tuviéramos por ejemplo un fichero (dentro del directorio /var/log) que rotase de la siguiente forma: file_001.log, file_002.log, ..., la clave del item quedaría de la siguiente forma: logrt["/var/log/file_.*.log","error"].

Apr 5, 2010

Monitorización de VMware ESXi con Zabbix (II)

Una vez que hemos establecido la infraestructura necesaria para poder monitorizar VMware ESXi con Zabbix, vamos a configurar Zabbix para poder realizar tal tarea.

Lo que he hecho ha sido desarrollar una plantilla para Zabbix, la cual está formada por 41 items (elementos encargados de obtener datos concretos) y 9 gráficos (utilizan los valores proporcionados por los items para representar los datos). En el siguiente link puede descargarse la plantilla: Template_ESXi.

Por lo tanto lo que haremos en primer lugar será ir a Configuration, Export/Import, con el objetivo de importar dicha plantilla. Una vez que la hayamos importado, iremos a la sección de Configuration, Host groups, y accederemos a la pantalla de Templates. Si pulsamos sobre el enlace Items, podremos ver la lista de todos los items que conforman la plantilla.


Hay uno de los items llamado "ESXi resxtop" el cual utiliza el script externo resxtop_esxi.sh para generar el fichero CSV (archivo que contiene los valores proporcionados por resxtop - consumo de CPU, memoria, disco, etc.) del VMware ESXi pasado a través de la macro HOSTNAME. Este item se ejecutará cada 30 sg de Lunes a Domingo. El resto de items utilizarán el script get_field_esxi.sh para obtener un valor concreto dentro del fichero CSV.


De esta forma si analizamos un item cualquiera, por ejemplo "Memory (Free)", podremos ver que al script get_field_esxi.sh se le pasarán dos argumentos a través de la línea de órdenes: la dirección IP o nombre del VMware ESXi (a través de la macro HOSTNAME) y el parámetro que queramos obtener dentro del fichero CSV. Para este caso concreto, como se quiere obtener la memoria que queda libre se le ha pasado la cadena de texto "\\Free MBytes".

Este item, que se ejecutará cada 30 sg de Lunes a Domingo, devolverá como resultado un número entero decimal que se corresponderá con los MB libres de memoria RAM. Para otros items lo único que cambiará será por ejemplo el tipo de resultado devuelto o la clase de unidad.


Esta plantilla ha sido creada teniendo en cuenta 8 cores, de ahí a que haya por ejemplo 8 items de tipo "Physical Cpu(0...7) Util Time". Por lo tanto, si la plantilla se utiliza para monitorizar otros VMware ESXi con menos cores, se pueden desactivar aquellos items no necesarios, o si por el contrario se dispone de más cores, se pueden añadir (clonar) más items.

Lo mismo ocurre también para el caso de los dos items relacionados con los interfaces de red: "Network Received Traffic (eth0)" y "Network Transmitted Traffic (eth0)". Si se tuviera algún VMware ESXi con otro interfaz de red, habría que clonar esos dos items y cambiar la cadena de texto "eth0" por "eth1".

La plantilla también dispone de 9 gráficos que utilizarán los items anteriormente comentados.


Si abrimos por ejemplo el gráfico de "Disk", podremos ver que hace uso de dos items: "Disk (Read)" y "Disk (Write)".


En la siguiente imagen podemos ver una de las gráficas (Physical Cpu Util Time) obtenidas por la plantilla Template_ESXi una vez que ha sido asignada a un VMware ESXi (ESXI01.LOCAL).

Mar 29, 2010

Monitorización de VMware ESXi con Zabbix (I)

Uno de las principales desventajas de VMware ESXi es su difícil monitorización.

A través del cliente vSphere podemos hacer un seguimiento de distintos parámetros de la máquina (CPU, memoria, disco, etc.) durante la última hora, situación que generalmente es insuficiente si se necesita mantener registrados dichos valores de cara a la posible resolución de una incidencia. Además a través de dicho cliente, tampoco podemos generar ningún tipo de alerta.

Una de las posibles alternativas que se tienen consiste combinar la herramienta resxtop con uno de los mejores softwares open source existentes para la monitorización de equipos: Zabbix.

La idea va a consistir en lanzar resxtop en modo batch, con el objetivo de recopilar los parámetros que nosotros le indiquemos a través del fichero de configuración de resxtop. Esta operación devolverá como resultado un fichero CSV. La aplicación resxtop será gestionada a través de un script en bash, el cual recibirá como parámetro a través de la línea de órdenes el nombre o dirección IP del VMware ESXi del cual queramos obtener su informe CSV.

A través de Zabbix podremos generar posteriormente un item que tenga asociado este script, y el cual se encargue de obtener el informe CSV de forma periódica.

A continuación y a través de otro script en bash (el cual recibirá como argumentos el nombre o dirección IP del VMware ESXi y el parámetro que se desee obtener - consumo de CPU, memoria libre, etc.), podremos obtener el valor asociado a un argumento concreto. De esta forma y posteriormente en Zabbix, podremos generar varios items que se encarguen de obtener dichos valores utilizando el script.

Para hacer las pruebas vamos a emplear Zabbix 1.8.1 instalado sobre un CentOS 5.4 de 64 bits.

Primero vamos a crear un script en bash denominado resxtop_esxi.sh, el cual reciba por la línea de órdenes el nombre del VMware ESXi (o dirección IP) que se desee monitorizar a través de resxtop (habría que sustituir xxxxxx por la password de root del ESXi).

[root@centos ~]# mkdir -p /etc/zabbix/externalscripts/resxtop_esxi/reports

[root@centos ~]# cd /etc/zabbix/externalscripts

[root@centos externalscripts]# cat resxtop_esxi.sh
#!/bin/bash

PATH_RESXTOP="/etc/zabbix/externalscripts/resxtop_esxi"

if [ "$2" == "" ]; then
echo 1 ; exit 1
fi

mv $PATH_RESXTOP/reports/$2.csv.tmp $PATH_RESXTOP/reports/$2.csv

echo 0
$PATH_RESXTOP/resxtop -b -n 1 -c $PATH_RESXTOP/esxtop4rc --server $2 --username root > $PATH_RESXTOP/reports/$2.csv.tmp << eof
xxxxxx
eof

[root@centos externalscripts]# chmod 700 resxtop_esxi.sh

El script anterior depositará los resultados dentro del directorio reports.

Para instalar resxtop en la máquina CentOS, he descargado la versión de esta aplicación para 64 bits y la he descomprimido directamente dentro del directorio /etc/zabbix/externalscripts/resxtop_esxi. Al intentar instalarla utilizando el script que trae consigo (vmware-install.pl) me ha dado varios problemas, así que he optado por instalarla manualmente.

Éstos son los pasos que he seguido:

[root@centos resxtop_esxi]# tar xvzf VMware-vSphere-CLI-4.0.0-198790.x86_64.tar.gz

[root@centos resxtop_esxi]# mkdir -p /etc/vmware-vcli/

[root@centos resxtop_esxi]# cat /etc/vmware-vcli/locations
answer LIBDIR /usr/lib/vmware-vcli

[root@centos resxtop_esxi]# mkdir -p /usr/lib/vmware-vcli/lib

[root@centos resxtop_esxi]# cp -a vmware-vsphere-cli-distrib/lib/lib64/wrapper-gtk24.sh /usr/lib/vmware-vcli/lib/

[root@centos resxtop_esxi]# cp -ar vmware-vsphere-cli-distrib/lib/bin /usr/lib/vmware-vcli/

[root@centos resxtop_esxi]# cp -ar vmware-vsphere-cli-distrib/lib/lib64 /usr/lib/vmware-vcli/

[root@centos resxtop_esxi]# cp -ar vmware-vsphere-cli-distrib/lib/lib32 /usr/lib/vmware-vcli/

[root@centos resxtop_esxi]# cp -a vmware-vsphere-cli-distrib/bin/resxtop .

[root@centos resxtop_esxi]# rm -rf vmware-vsphere-cli-distrib/

Si tenemos activado SELinux, tendremos que ejecutar las dos siguientes órdenes:

[root@centos resxtop_esxi]# chcon -t textrel_shlib_t '/usr/lib/vmware-vcli/lib32/libvmacore.so.1.0/libvmacore.so.1.0'

[root@centos resxtop_esxi]# semanage fcontext -a -t textrel_shlib_t '/usr/lib/vmware-vcli/lib32/libvmacore.so.1.0/libvmacore.so.1.0'

El fichero de configuración de resxtop tendrá el siguiente contenido:

[root@centos resxtop_esxi]# cat esxtop4rc


AG

DHIJK

5c

De esta forma diremos a resxtop que obtenga los parámetros generales de CPU y memoria (dos primeras líneas en blanco) y los datos concretos para cada una de las unidades de disco e interfaces de red (líneas cuarta y sexta).

Si echamos un vistazo al fichero CSV que crea resxtop, podremos ver que se trata de una tabla con dos filas y múltiples columnas, una por cada uno de los datos registrados.

[root@centos resxtop_esxi]# resxtop -b -n 1 -c esxtop4rc --server esxi.local --username root > esxi.local.csv

[root@centos resxtop_esxi]# cat esxi.local.csv
"(PDH-CSV 4.0) (CET)(0)","\\esxi.local\Memory\Memory Overcommit (1 Minute Avg)","\\esxi.local\Memory\Memory Overcommit (5 Minute Avg)"...
...

[root@centos resxtop_esxi]# cat esxi.local.csv | cut -d',' -f 2
"\\esxi.local\Memory\Memory Overcommit (1 Minute Avg)"
"0.00"

Por lo tanto lo que vamos a hacer será un script en AWK que se encargue de obtener el valor del campo concreto que le indiquemos.

[root@centos resxtop_esxi]# cat parser_resxtop.awk
BEGIN {
FS = "," ; RS = ""
}

{
for (i = 1; i <= NF/2; i++)
if ( index($i, field) != 0 )
{
gsub("\"","",$(i + NF/2))
print $(i + NF/2)
break
}
}

[root@centos resxtop_esxi]# awk -v field="Memory Overcommit (1 Minute Avg)" -f parser_resxtop.awk reports/esxi.local.csv
0.00

Y por último, vamos a hacer un script llamado get_esxi_field.sh que recibirá dos argumentos por la línea de órdenes: el primero será el nombre o dirección IP del ESXi del cual se quiera obtener un cierto parámetro (CPU, memoria, etc.) y el segundo argumento será la cadena de texto que indique dicho argumento (Por ejemplo "Memory Overcommit (1 Minute Avg)").

[root@centos resxtop_esxi]# cd ..

[root@centos externalscripts]# cat get_esxi_field.sh
#!/bin/bash

PATH_SCRIPTS="/etc/zabbix/externalscripts/resxtop_esxi"

if [ "$2" == "" -o "$3" == "" ]; then
echo 1 ; exit 1
fi

echo "$(awk -v field="$3" -f $PATH_SCRIPTS/parser_resxtop.awk $PATH_SCRIPTS/reports/$2.csv)"

[root@centos externalscripts]# chmod +x get_esxi_field.sh

[root@centos externalscripts]# chown -R zabbix:zabbix /etc/zabbix/externalscripts

El árbol de ficheros y directorios de la estructura de monitorización que acabamos de crear quedaría de la siguiente forma:

[root@centos ~]# tree /etc/zabbix/externalscripts
/etc/zabbix/externalscripts
|-- get_esxi_field.sh
|-- resxtop_esxi
| |-- esxtop4rc
| |-- parser_resxtop.awk
| |-- reports
| `-- resxtop
`-- resxtop_esxi.sh

2 directories, 5 files