Dec 2, 2012

MySQL benchmark with SysBench (II)

Let's carry on the preceding article about MySQL benchmark with SysBench by putting into action the above scenario.

For the first case, I am going to use the values recommended through the first four articles that I wrote about MySQL optimization. So according to them, the values used will be as follows. Let's call this first settings A.

root@ubuntu-server:~# vim /etc/mysql/my.cnf
...
key_buffer              = 32M
thread_cache_size       = 512
table_cache             = 512
table_definition_cache  = 512
open_files_limit        = 1024
tmp_table_size          = 64M
max_heap_table_size     = 32M
query_cache_limit       = 4M
query_cache_size        = 256M
query_cache_type        = 1
innodb_buffer_pool_size = 1280M

For the second configuration, called B, I am going to set by means of the parameter innodb-flush-log-at-trx-commit, when the log buffer will be written out to the log file and the flush to disk operation will be effected.

root@ubuntu-server:~# vim /etc/mysql/my.cnf
...
innodb-flush-log-at-trx-commit = 0

For the third combination (C), a new parameter will be added: innodb_buffer_pool_instances. With this option, it is possible to define the number of regions that the InnoDB area will be divided into.

root@ubuntu-server:~# vim /etc/mysql/my.cnf
...
innodb_buffer_pool_instances = 2

And finally, the size for the log file will be increased by means of innodb_log_file_size, and in this way, the graph D will be turned out (in order to be able to apply this change, first up you have to stop MySQL and remove any existing log file).

root@ubuntu-server:~# vim /etc/mysql/my.cnf
...
innodb_log_file_size = 256M

root@ubuntu-server:~# rm -rf /var/lib/mysql/ib_logfile*

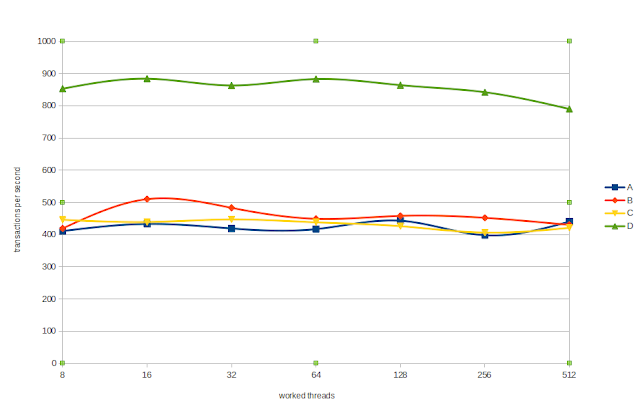
Below you can observe the graphs generated for the different cases.


As you can appreciate in the figure, the best improvements are achieved when the size of the log file is increased from its default value (5M) to 256M. The option C, that is, to separate the InnoDB buffer into two regions gets worse in respect of the previous alternative (B).


Nov 25, 2012

MySQL benchmark with SysBench (I)

By taking advantage of the previous article about MySQL optimization, I am going to introduce a handy tool called SysBench and aimed at measuring the performance of a MySQL database among other things. In addition, it is also able to evaluate the I/O, scheduler and threads implementation performance, and memory allocation and transfer speed.

So I am going to use this tool in order to verify the improvements commented in the preceding article and related to some parameters of MySQL. The test will be run on Ubuntu Server 12.10 virtualized through VMware. The virtual machine will made up by a 6 GB hard drive, 2 GB of RAM and a couple of virtual cores.

First of all, let's install MySQL and SysBench and increase the default number of maximum connections to 512.

root@ubuntu-server:~# aptitude install mysql-server sysbench

root@ubuntu-server:~# vim /etc/mysql/my.cnf
...
max_connections = 512

root@ubuntu-server:~# service mysql restart

Now let's create a table of 1.000.000 of rows in a database called test by using SysBench.

root@ubuntu-server:~# sysbench --test=oltp --oltp-table-size=1000000 --mysql-db=test --mysql-user=root --mysql-password=xxxxxx prepare

Then a straightforward script taken care of running the tests will be developed. This bash script executes the OLTP (OnLine Transaction Processing) test on a table of 1.000.000 of rows. The time limit for the whole execution will be 300 seconds and read, update, delete and insert queries will be performed. The total number of maximum requests will be unlimited.

root@ubuntu-server:~# cat script.sh 
#!/bin/bash

for i in 8 16 32 64 128 256 512
do
    service mysql restart ; sleep 5
    sysbench --test=oltp --oltp-table-size=1000000 --mysql-db=test --mysql-user=root --mysql-password=xxxxxx --max-time=300 --oltp-read-only=off --max-requests=0 --num-threads=$i run
done

As you can see in the above script, the number of worked threads to be created will be different in each loop iteration, from 8 to 512. So the idea is to run the script with various MySQL combinations and calculate the number of transactions per second.


Nov 18, 2012

MySQL optimization (V)

I am going to reopen the last article that I wrote about MySQL optimization because I came across three new parameters (for me) which enhance the performance of a MySQL database, and I would like to note down them on my blog.

The first parameter is innodb-flush-log-at-trx-commit, which manages both when the log buffer is written out to the log file and the flush to disk operation is performed. Its default value is 1, which means that the log buffer is dumped to the log file at each transaction commit and the flush to disk operation is carried out directly on the log file.

When its value is 0, the log buffer is sent to the log file once per second, so in this way, you are turning down the disk accesses. In respect of the flush to disk, the operation is also effected on the log file but not coinciding with the commit, but taking advantage of free periods. And when it takes the value of 2 (less aggressive than 0), the log buffer is written out to the log file at each commit but as in the previous case, the flush is done at any free moment for the server.

The other parameter that I would like to talk about is innodb_buffer_pool_instances (in case of you are using the InnoDB engine), which represents the number of regions that the InnoDB buffer is broken up.  This parameter is really useful when you are using a server with several cores, and thereby, each core (thread) can work on a separate instance. A good recommendation is to set it to the same value as the number of cores, but another popular option is to follow the next rule: (innodb_buffer_pool_size [in GB] + number of cores) / 2.

And finally, the last parameter is innodb_log_file_size, related to the InnoDB log file. Its default value is 5 MB and I consider that is not enough for production environments. The larger the value is, the less control flush activity is needed in the buffer pool, saving disk I/O operations. I think that a right value would be between 64 and 256 MB.


Nov 4, 2012

Zabbix poller processes more than 75% busy and queue delay (III)

Let's complete the last article about Zabbix poller processes more than 75% busy and queue delay. In this section, I am going to tackle the part of the client, that is, those things which can be modified on the agent so as to remove or attenuate the issues mentioned in the first article.

Remember that this is the continuation of the two previous articles:


First up, I changed the number of pre-forked instances of the Zabbix client which process passive checks (StartAgents) to 64. This parameter is really meaningful, because its default value is 5, that is to say, only five processes will be started in order to obtain the data requested by the server. So if you have a lot of items and a small monitoring period (as my case), you will need more processes to be able to attend all requests.

root@zabbix-client:~# cat /etc/zabbix/zabbix_agentd.conf
...
StartAgents=64

So let's see now in the graphs, how this change impacts on the results. Let's first with the Zabbix server performance.


And then, the Zabbix data gathering process.


As you can see on the first picture, the server has gone from a Zabbix queue of 30 to 0 (although you can observe 5 on the figure, think that the graph has been cut out). And on the second one, the Zabbix busy poller processes went from 24% to 0%.

Other parameters that you can play with are the number of seconds that the data can be stored in the buffer and its maximum number of values.

root@zabbix-client:~# cat /etc/zabbix/zabbix_agentd.conf
...
BufferSend=3600

BufferSize=65535

Also keep in mind that you should have a small value for the timeout (I am using five seconds on my installation).

Lastly, in order to solve the problem that I mentioned in the first article about from time to time, the processes break down and the zabbix agent is stopped, I developed a simple bash script to work around this issue.

root@zabbix-client:~# tail -f /var/log/zabbix/zabbix_agentd.log
...
zabbix_agentd [17271]: [file:'cpustat.c',line:155] lock failed: [22] Invalid argument
 17270:20121015:092010.216 One child process died (PID:17271,exitcode/signal:255). Exiting ...
...
 17270:20121015:092012.216 Zabbix Agent stopped. Zabbix 2.0.3 (revision 30485).


root@zabbix-client:~# cat /etc/zabbix/monitor_zabbix.sh
#!/bin/bash

while [ 1 ];
do
        if ! pgrep -f "/usr/local/sbin/zabbix_agentd -c /etc/zabbix/zabbix_agentd.conf" &> /dev/null ; then
                /etc/zabbix/zabbix.sh start
        fi
        sleep 15
done

This script is run in batch mode and takes care of monitoring the status of the agent processes and starting over when they drop . It uses another bash script to start and stop the agents.

root@zabbix-client:~# cat /etc/zabbix/zabbix.sh
#!/bin/bash

case $1 in
        "start")
                taskset -c $(($(cat /proc/cpuinfo | grep processor | wc -l) - 1)) /usr/local/sbin/zabbix_agentd -c /etc/zabbix/zabbix_agentd.conf;;
        "stop")
                pkill -f "/usr/local/sbin/zabbix_agentd -c /etc/zabbix/zabbix_agentd.conf";;
        *)
                printf "./zabbix.sh start|stop\n\n"
esac


Oct 28, 2012

Zabbix poller processes more than 75% busy and queue delay (II)

After putting forward the issues turned up on my current Zabbix installation and related to its performance (Zabbix poller processes more than 75% busy and queue delay), I am going to explain to you how I solved it.

First of all, I tried out to increase the number of pre-forked instances of pollers for the Zabbix server, that is, I changed its default value from 5 to 256 (remember that for that case, you have to set the the number of maximum connections in MySQL - max_connections - higher than 256, since every single poller opens a dedicated connection to the database).

root@zabbix-server:~# cat /etc/zabbix/zabbix_server.conf
...
# StartPollers=5
StartPollers=256

root@zabbix-server:~# cat /etc/mysql/my.cnf
...
max_connextions = 512

Below you can see the outcome after applying it (Zabbix server performance).


And the Zabbix data gathering process.


In the first figure, you can observe that the Zabbix queue has gone from 48 to 30 (approximately), and for the second one, the Zabbix busy poller processes went from 100% to 24%. So it is clear that if you have a server with enough resources, there is no problem to start many pollers. These kind of processes are responsible for requesting the data defined in the items, so the more pollers have available, the less overloaded the system is.

Other Zabbix server parameter that you ought to take into account is for example the Timeout (specifies how log pollers wait for agent responses). Try not to assign a very high value. Otherwise, the system might get overloaded.

Next week, I will end up this series of articles by accomplishing the part of the client.


Oct 21, 2012

sysstat vs top vs ps (III)

Let's finish the series of articles related to the differences in the measure of sysstat, top and ps.

What about the system CPU time (%sy) of the first top from the previous article? It is 39.7%. It is right as well. You have to take into account that, because this server has a couple of cores, that data represents the average from both cores. You can see this point by running top into interactive mode and pressing the number 1. Then you will be able to obtain the consumption for both cores.

root@ubuntu-server:~# top
top - 20:04:37 up 47 min,  1 user,  load average: 0.40, 0.54, 0.60
Tasks:  87 total,   1 running,  86 sleeping,   0 stopped,   0 zombie
Cpu0  :  2.9%us, 37.7%sy,  0.0%ni, 59.4%id,  0.0%wa,  0.0%hi,  0.0%si,  0.0%st
Cpu1  :  1.6%us, 40.8%sy,  0.0%ni, 57.1%id,  0.0%wa,  0.0%hi,  0.5%si,  0.0%st
Mem:   1024800k total,   207680k used,   817120k free,    23532k buffers
Swap:  1048572k total,        0k used,  1048572k free,   100320k cached

  PID USER      PR  NI  VIRT  RES  SHR S %CPU %MEM    TIME+  COMMAND
 1561 root      20   0 29280 4180 2416 S  128  0.4  56:57.23 script.py

At any rate, the sum of both percentages does not match the %CPU used by the script. This might be due to the sampling frequencies commented in the preceding article.

Finally, I would like to remark that in order to monitor threads, I like to use pidstat with the -t parameter.

root@ubuntu-server:~# pidstat -u -t -p 1561 1 1
Linux 3.2.0-30-generic-pae (ubuntu-server)     09/30/2012     _i686_    (2 CPU)

08:14:47 PM      TGID       TID    %usr %system  %guest    %CPU   CPU  Command
08:14:48 PM      1561         -    9.00  119.00    0.00  128.00     1  script.py
08:14:48 PM         -      1561    0.00    0.00    0.00    0.00     1  |__script.py
08:14:48 PM         -      1562    4.00   60.00    0.00   64.00     0  |__script.py
08:14:48 PM         -      1563    4.00   59.00    0.00   63.00     1  |__script.py

This tool is great because you can see the core where the thread (or process) is being executed.

Another interesting choice is to use directly the ps command with the suitable parameters (-L shows threads and sgi_p the processor where the process is currently executing on).

root@ubuntu-server:~# ps -Leo pid,pcpu,sgi_p,command | grep '^ 1561'
 1561  0.0 * /usr/bin/python ./script.py
 1561 65.6 0 /usr/bin/python ./script.py
 1561 65.2 0 /usr/bin/python ./script.py

Also point out for the above output that, ps does not offer the number of TID (Thread ID), in contradistinction to top and pidstat (remember that a thread does not have PID).


Oct 15, 2012

Zabbix poller processes more than 75% busy and queue delay (I)

In my previous job, I had to set up a Zabbix infrastructure in order to monitor more than 400 devices between switches and servers. The main feature of this architecture was that there were a lot of machines, but the update interval was large (around 30 seconds) and the number of items small.

For this purpose, I wrote down a couple of articles related to this issue:


But in my current position, I am starting to introduce Zabbix (2.0.3 on Ubuntu Server 12.04) with the aim of controlling few devices where a large number of items and a small monitoring period are required. This situation leads to an overload of the Zabbix server, on the one hand by increasing the number of monitored elements delayed in the queue, and on the other, turning out that the poller processes are busy long.

In addition, I have been able to observe that, from time to time, the agent goes down in an unexpected way. If you take a look at the log file from the client (debug mode), the following error lines are dumped.

root@zabbix-client:~# tail -f /var/log/zabbix/zabbix_agentd.log
...
zabbix_agentd [17271]: [file:'cpustat.c',line:155] lock failed: [22] Invalid argument
 17270:20121015:092010.216 One child process died (PID:17271,exitcode/signal:255). Exiting ...
 17270:20121015:092010.216 zbx_on_exit() called
 17272:20121015:092010.216 Got signal [signal:15(SIGTERM),sender_pid:17270,sender_uid:0,reason:0]. Exiting ...
 17273:20121015:092010.216 Got signal [signal:15(SIGTERM),sender_pid:17270,sender_uid:0,reason:0]. Exiting ...
 17274:20121015:092010.216 Got signal [signal:15(SIGTERM),sender_pid:17270,sender_uid:0,reason:0]. Exiting ...
 17270:20121015:092012.216 Zabbix Agent stopped. Zabbix 2.0.3 (revision 30485).

Below you can observe a figure which shows the Zabbix server performance (queue) for the aforementioned case.


And the other one, reflects the Zabbix data gathering process (pay attention to the data Zabbix busy poller processes, in %).


For the first case, the Zabbix queue has averaged more than 50 monitored items delayed, and for the second one, the poller processes are busy about 100% of the time. This situation can produce that, sometimes, Zabbix draws sporadic dots rather than lines in the graphs. Another effect that you can get from this condition is that if you set a short update interval for an item, you could run into lack of data when you check the values gathered later.


Also say that I followed the tuning guide that I mentioned before, but as you can see, Zabbix server was acting up.


Oct 6, 2012

sysstat vs top vs ps (II)

Following up on the previous article, sysstat vs top vs ps (I), a curious case that I would like to talk about is when you use more than one core. Let's create a simple script in Python which runs a couple of threads a little bit overloaded.

root@ubuntu-server:~# nproc 
2

root@ubuntu-server:~# cat script.py 
#!/usr/bin/python

import threading, time

def sleep():
    while True:
        time.sleep(0.000001)

t1 = threading.Thread(target=sleep)
t2 = threading.Thread(target=sleep)

t1.start()
t2.start()

t1.join()
t2.join()

root@ubuntu-server:~# ./script.py &
[1] 1561

If we take a look now at the status of this process by means of top, we can see as follows.

root@ubuntu-server:~# top -b -n 1 -p 1561
top - 19:41:19 up 24 min,  1 user,  load average: 0.74, 0.66, 0.48
Tasks:   1 total,   0 running,   1 sleeping,   0 stopped,   0 zombie
Cpu(s):  5.3%us, 39.7%sy,  0.0%ni, 55.0%id,  0.0%wa,  0.0%hi,  0.0%si,  0.0%st
Mem:   1024800k total,   205596k used,   819204k free,    23192k buffers
Swap:  1048572k total,        0k used,  1048572k free,    98712k cached

  PID USER      PR  NI  VIRT  RES  SHR S %CPU %MEM    TIME+  COMMAND
 1561 root      20   0 29280 4180 2416 S  129  0.4  26:23.26 script.py

So what would be the first weird thing that you can observe from the previous screen? The script is consuming 129% of the CPU. This is right because you have to remember that this virtual machine has two cores and the script, rather, its two threads, are using the two ones and that figure is the combination of the CPU utilization from both cores. You can appreciate this situation much better if you execute top with the -H option.

root@ubuntu-server:~# top -b -H -n 1 -p 1561
top - 19:44:22 up 27 min,  1 user,  load average: 0.69, 0.72, 0.54
Tasks:   3 total,   2 running,   1 sleeping,   0 stopped,   0 zombie
Cpu(s):  4.3%us, 38.9%sy,  0.0%ni, 56.8%id,  0.0%wa,  0.0%hi,  0.0%si,  0.0%st
Mem:   1024800k total,   205624k used,   819176k free,    23192k buffers
Swap:  1048572k total,        0k used,  1048572k free,    98712k cached

  PID USER      PR  NI  VIRT  RES  SHR S %CPU %MEM    TIME+  COMMAND
 1563 root      20   0 29280 4180 2416 R   65  0.4  15:10.19 script.py
 1562 root      20   0 29280 4180 2416 R   64  0.4  15:12.39 script.py
 1561 root      20   0 29280 4180 2416 S    0  0.4   0:00.05 script.py


Sep 30, 2012

sysstat vs top vs ps (I)

I have always been using several tools to get the CPU utilization of Linux processes through different tools such as top, ps, sar, etc., but so far, I did not realise that the results obtained from them can vary considerably.

For example, I am going to run a job and measure its CPU usage afterwards. Also say that a virtual machine (Ubuntu Server 12.04) with only one core will be used.

root@ubuntu-server:~# nproc 
1

root@ubuntu-server:~# while [ 1 ] ; do sleep 0.0001 ; done &
[1] 5605

Now let's show its performance by means of top, ps and pidstat (this command belongs to the sysstat package, which also provides the sar utility, used to collect, report, or save system activity information).

root@ubuntu-server:~# top -b -n 1 -p 5605 | grep bash | awk '{print $9}'
37.9

root@ubuntu-server:~# ps -eo pid,pcpu | grep '^ 5605' | awk '{print $2}'
37.8

root@ubuntu-server:~# pidstat -u -p 5605 1 1 | grep bash | head -n 1 | awk '{print $7}'
45.12

If you go over the definitions of these measures, you can read as follows:

  • top (%CPU): the task's share of the elapsed CPU time since the last screen update, expressed as a percentage of total CPU time.
  • ps (%CPU): cpu utilization of the process in "##.#" format. Currently, it is the CPU time used divided by the time the process has been running (cputime/realtime ratio), expressed as a percentage.
  • pidstat (%CPU): total percentage of CPU time used by the task. In an SMP environment, the task's CPU usage will be divided by the total number of CPU's if option -I has been entered on the command line.

What is my opinion? All data turned out try to display the CPU utilization of a process during a period of time, but the key is that period of time taken to work out the result, and I think that for pidstat is different that for top and ps.

So my conclusion is that all aforementioned tools are correctly valid, and they will give back you a correct idea about the behaviour of a process in terms of CPU.


Sep 16, 2012

Managing passwords with MyPasswords

From a long time, I was looking for a tool in order to handle all my passwords, and by trying out different options, I came across MyPasswords, an easy and handy application which allows you to store your credentials within a Derby database.

What can I highlight from this tool? First of all, it is really fast and does not require any installation, that is, we are talking about a java application that can be run on Linux, Unix, Solaris, Mac, Windows, etc. Secondly, you can easily export the repository to a XML file, so as to bring it back later. And finally, MyPasswords works with tags, that is to say, a tag can be added to each element stored in the database, and in this way, it is straightforward to locate an item at any given time.

For this article, I am going to use the latest version available on the website: 2.92. After grabbing and unpacking it, you can execute it by running the shell script called MyPasswords.sh (a simple script which launches the java file). Then, you will be able to see a screen as follows.


Don't forget to take a look at the readme.txt file, since it is wrote down the default password used to start MyPasswords.

As you can appreciate in the previous image, the main window allows you to create a new entry, by fulfilling the fields that you want to store for your item, such as the username and password. Pay attention to the Strength field, as MyPasswords is able to warn you about the strength of the password introduced.

I recommend you to use the password generator utility provided by MyPasswords, and turn out passwords with at least 16 alphanumeric characters (much better if you add symbols as well).

The Tags field is very practical, since it allows you later to look up your items by browsing a tag tree. In addition, you have the Search option, used to find elements by using titles and tags. Also point out that it is a good idea to export your encrypted repository to a XML file from time to time, as a backup. If so, you will have to supply a password in order to preserve the generated file.

Lastly, remember to change the default password used by MyPasswords. It is necessary that this password is really strong, as it will be the key to access all your passwords.


Sep 3, 2012

Remote log server via HTTP (IV)

Through the following text, let's end up the series of articles related to the installation and configuration of a log server via HTTP (I, II and III).

Next, Apache is going to be installed and tuned based on the kind of service which will be offered (static data), taking out those unnecessary modules, adjusting the parameters of Apache according to the  content served and modifying those variables which affect the security of the web server.

[root@server ~]# yum install httpd

[root@server ~]# cat /etc/httpd/conf/httpd.conf
...
# Remove the information about the server version
ServerTokens Prod
...
# Do not cache the web pages
ExpiresActive Off
...
# Number of second before receiving and sending a time out
Timeout 20
...
# Not allow persistent connections
KeepAlive Off
...
# prefork MPM
<IfModule prefork.c>
   StartServers          50
   MinSpareServers       35
   MaxSpareServers       70
   ServerLimit           512
   MaxClients            512
   MaxRequestsPerChild   4000
</IfModule>
...
# Name used by the server to identify itself
ServerName localhost
...
# Protect the root directory
<Directory />
   Options -FollowSymLinks
   Order deny,allow
   Deny from all
</Directory>

# Default charset for all content served
AddDefaultCharset ISO-8859-15
...

In the configuration file, it can be observed that the ISO-8859-15 standard has been used as charset to offer the data by the web server. That is because with UTF-8, accents are represented with strange characters by Firefox.

Make sure that the welcome.conf file has got the following lines to allow to index the content and not the welcome page.

[root@server ~]# cat /etc/httpd/conf.d/welcome.conf
<LocationMatch "^/+$">
   Options Indexes
   ErrorDocument 403 /error/noindex.html
</LocationMatch>

Finally, a virtual host will be created in order to serve the log files.

[root@server ~]# cat /etc/httpd/conf.d/logserver.conf
NameVirtualHost 192.168.1.10:80

<VirtualHost 192.168.1.10:80>
   ServerName server.local
   DocumentRoot /mnt/shared/logs
   ErrorLog /var/log/httpd/logserver-error_log
   CustomLog /var/log/httpd/logserver-access_log common
   <Directory "/mnt/shared/logs">
      Options Indexes
      AllowOverride None
      EnableSendfile Off
      Order allow,deny
      Allow from all
   </Directory>
</VirtualHost>

It is important to highlight the EnableSendfile directive (enabled by default), allowing Apache to use the sendfile support included in the Linux kernel. Through this feature, Apache will not read the static files, but the kernel will offer them directly. But it happens that when Apache serves data from NFS or Samba and network outages take place, the connection can turn into an unstable state. So for this case, it is much better to deactivate it.

Now you have to run Apache and make it automatically start during the booting of the machine.

[root@server ~]# service httpd restart

[root@server ~]# chkconfig httpd on

In order to secure the web server, iptables will be configured with the following settings.

[root@server ~]# cat /etc/sysconfig/iptables
*filter
:INPUT ACCEPT [0:0]
:FORWARD ACCEPT [0:0]
:OUTPUT ACCEPT [0:0]
:RH-Firewall-1-INPUT - [0:0]
-A INPUT -j RH-Firewall-1-INPUT
-A FORWARD -j RH-Firewall-1-INPUT
-A RH-Firewall-1-INPUT -i lo -j ACCEPT
-A RH-Firewall-1-INPUT -m state --state ESTABLISHED,RELATED -j ACCEPT
-A RH-Firewall-1-INPUT -p tcp --dport ssh -j ACCEPT
-A RH-Firewall-1-INPUT -p tcp --dport http -j ACCEPT
-A RH-Firewall-1-INPUT -p icmp -j ACCEPT
-A RH-Firewall-1-INPUT -j LOG
-A RH-Firewall-1-INPUT -j REJECT
COMMIT

[root@server ~]# service iptables restart

[root@server ~]# chkconfig iptables on

Lastly, the backup for the logs will be scheduled through cron by running a task with rsync every 15 minutes.

[root@server ~]# yum install rsync

[root@server ~]# cat /etc/crontab
...
*/15 * * * * /usr/bin/rsync -altgvb /mnt/shared/logs/nfs /backup/logs/nfs
*/15 * * * * /usr/bin/rsync -altgvb /mnt/shared/logs/samba /backup/logs/samba


Aug 27, 2012

GPT, beyond the MBR (II)

Let's follow up on the second part of the article about GPT, beyond the MBR.

Now, a new GPT partition table is going to be created by means of parted, and afterwards, it will be displayed.

root@ubuntu-server:~# parted /dev/sdb mklabel gpt

root@ubuntu-server:~# parted /dev/sdb print
Model: VMware, VMware Virtual S (scsi)
Disk /dev/sdb: 1074MB
Sector size (logical/physical): 512B/512B
Partition Table: gpt

Number  Start  End  Size  File system  Name  Flags

If you try to edit the partition table with fdisk, you will come across a message as follows.

root@ubuntu-server:~# fdisk /dev/sdb 

WARNING: GPT (GUID Partition Table) detected on '/dev/sdb'! The util fdisk doesn't support GPT. Use GNU Parted.
...

Let's create for example ten primary partitions of 10 MB each through a simple bash script.

root@ubuntu-server:~# j=1 ; for ((i=11; i<=101; i+=10)); do parted /dev/sdb mkpart primary $j $i; j=$i ; done

root@ubuntu-server:~# parted /dev/sdb print
Model: VMware, VMware Virtual S (scsi)
Disk /dev/sdb: 1074MB
Sector size (logical/physical): 512B/512B
Partition Table: gpt

Number  Start   End     Size    File system  Name     Flags
 1      1049kB  10.5MB  9437kB               primary
 2      10.5MB  21.0MB  10.5MB               primary
 3      21.0MB  31.5MB  10.5MB               primary
 4      31.5MB  40.9MB  9437kB               primary
 5      40.9MB  51.4MB  10.5MB               primary
 6      51.4MB  60.8MB  9437kB               primary
 7      60.8MB  71.3MB  10.5MB               primary
 8      71.3MB  80.7MB  9437kB               primary
 9      80.7MB  91.2MB  10.5MB               primary
10      91.2MB  101MB   9437kB               primary

If we take a look at the GPT table, we can distinguish the following parts.

root@ubuntu-server:~# dd if=/dev/sdb bs=512 count=4 | xxd -c 16
0000000: 0000 0000 0000 0000 0000 0000 0000 0000  ................
...
00001f0: 0000 0000 0000 0000 0000 0000 0000 55aa  ..............U.
0000200: 4546 4920 5041 5254 0000 0100 5c00 0000  EFI PART....\...
...
0000400: a2a0 d0eb e5b9 3344 87c0 68b6 b726 99c7  ......3D..h..&..
0000410: 4e6e ad36 2fec 8046 bc1f 4a42 82d2 8052  Nn.6/..F..JB...R
0000420: 0008 0000 0000 0000 ff4f 0000 0000 0000  .........O......
0000430: 0000 0000 0000 0000 7000 7200 6900 6d00  ........p.r.i.m.
0000440: 6100 7200 7900 0000 0000 0000 0000 0000  a.r.y...........
...

First up, it is the legacy MBR, which GPT holds for reasons of compatibility (the code 0x55AA points to the end of the MBR). The second part of the GPT (512 bytes) contains the header information for GUID partitioning. And the first partition entry appears in position 0x400.


Aug 18, 2012

GPT, beyond the MBR (I)

Have you ever wondered what are the limits of the MBR (Master Boot Record)? I mean, the maximum size of a partition or a entire hard drive able to be handled. The answer is 2.2 TB.

Below you can observe the structure of the MBR (a total size of 512 bytes, where each row is 32 bytes).

root@ubuntu-server:~# dd if=/dev/sda bs=512 count=1 | xxd -g 4 -c 32
0000000: eb639010 8ed0bc00 b0b80000 8ed88ec0 fbbe007c bf0006b9 0002f3a4 ea210600  .c.................|.........!..
0000020: 00bebe07 3804750b 83c61081 fefe0775 f3eb16b4 02b001bb 007cb280 8a74018b  ....8.u........u.........|...t..
0000040: 4c02cd13 ea007c00 00ebfe00 00000000 00000000 00000000 00000080 01000000  L.....|.........................
0000060: 00000000 fffa9090 f6c28074 05f6c270 7402b280 ea797c00 0031c08e d88ed0bc  ...........t...pt....y|..1......
0000080: 0020fba0 647c3cff 740288c2 52bb1704 80270374 06be887d e81701be 057cb441  . ..d|<.t...R....'.t...}.....|.A
00000a0: bbaa55cd 135a5272 3d81fb55 aa753783 e1017432 31c08944 04408844 ff894402  ..U..ZRr=..U.u7...t21..D.@.D..D.
00000c0: c7041000 668b1e5c 7c66895c 08668b1e 607c6689 5c0cc744 060070b4 42cd1372  ....f..\|f.\.f..`|f.\..D..p.B..r
00000e0: 05bb0070 eb76b408 cd13730d f6c2800f 84d000be 937de982 00660fb6 c68864ff  ...p.v....s..........}...f....d.
0000100: 40668944 040fb6d1 c1e20288 e888f440 8944080f b6c2c0e8 02668904 66a1607c  @f.D...........@.D.......f..f.`|
0000120: 6609c075 4e66a15c 7c6631d2 66f73488 d131d266 f774043b 44087d37 fec188c5  f..uNf.\|f1.f.4..1.f.t.;D.}7....
0000140: 30c0c1e8 0208c188 d05a88c6 bb00708e c331dbb8 0102cd13 721e8cc3 601eb900  0........Z....p..1......r...`...
0000160: 018edb31 f6bf0080 8ec6fcf3 a51f61ff 265a7cbe 8e7deb03 be9d7de8 3400bea2  ...1..........a.&Z|..}....}.4...
0000180: 7de82e00 cd18ebfe 47525542 20004765 6f6d0048 61726420 4469736b 00526561  }.......GRUB .Geom.Hard Disk.Rea
00001a0: 64002045 72726f72 0d0a00bb 0100b40e cd10ac3c 0075f4c3 ab9d0600 00008020  d. Error...........<.u......... 
00001c0: 2100831a 3b1f0008 00000098 0700003b 1b1f051f d00ffea7 07000250 b8000000  !...;..........;...........P....
00001e0: 00000000 00000000 00000000 00000000 00000000 00000000 00000000 000055aa  ..............................U.

The first 440 bytes contains the bootstrap code area, which takes care of starting up the operating system present on the active partition. Then, it is the disk signature, a 4-byte number that is randomly generated when the MBR is first created. It is an identifier which applies to the whole hard drive (not a single partition). After that, there are a couple of bytes set to null, and next, the partition table.

The partition table is made up of four entries of 16 bytes each which define the position and size of the sectors (LBA or Logical Block Addressing). In order to work around the problem of having just four partitions, these primary partitions can contain an arbitrary number of logical partitions. This schema can lead to problems, because some operating systems can only boot from primary partitions.

On the other hand, how do I work out the figure of 2.2 TB as top size for a partition? In conjunction with the universal sector size of 512 bytes and the 32-bit LBA pointers used by MBR partitions, you have ( 2^32 ) - 1 sectors * 512 bytes per sector.

(Also say that the MBR ends with the sequence of two bytes 0x55AA).

On account of the current size of hard drives and RAID technologies, the problem is really serious and will become more severe over time. In order to overcome it, the GUID partition table (GPT) is the natural successor to the MBR partition table.

GPT, supported on Linux since the 2.6.25 kernel version, uses 128-byte LBA modern tables, so therefore it is possible to have hard drives up to 8 ZB addressable for a disk with a 512-byte sector size. In addition, GPT can manage up to 128 partitions, so there is no need for extended or logical partitions. If you are interested, you can read up more about this topic on the Internet, since the aim of this article is to put forward how to manage this technology on Linux (also mention that for my tests, I used an Ubuntu Server 12.04 distribution).

First of all, point out that fdisk does not work with this partitioning scheme, but the good news is that can be got over with other Linux tools, such as parted. Keeping on with the tests, I have added a second hard drive to my system.

root@ubuntu-server:~# fdisk -l /dev/sdb 

Disk /dev/sdb: 1073 MB, 1073741824 bytes
255 heads, 63 sectors/track, 130 cylinders, total 2097152 sectors
Units = sectors of 1 * 512 = 512 bytes
Sector size (logical/physical): 512 bytes / 512 bytes
I/O size (minimum/optimal): 512 bytes / 512 bytes
Disk identifier: 0x00000000

Disk /dev/sdb doesn't contain a valid partition table


Aug 12, 2012

Remote log server via HTTP (III)

Once finished the second article about the configuration of Samba, Remote log server via HTTP (II), now the server is going to be set up in order to be able to import the log directories via NFS and Samba. Furthermore, they will be served via Apache and backed up from time to time.

First of all, you have to create the directory where the logs will be mounted, as well as the backup directories.

[root@server ~]# mkdir -p /mnt/shared/logs 

[root@server ~]# mkdir -p /backup/logs/nfs /backup/logs/samba

So that SELinux allows Apache to access a directory brought by NFS or Samba, you have to enable the variables httpd_use_nfs and httpd_use_cifs. In addition, you have to change the SELinux security context of each directory imported.

[root@server ~]# setsebool -P httpd_use_nfs=on httpd_use_cifs=on

[root@server ~]# chcon -R -u system_u /mnt/shared/logs

[root@server ~]# chcon -R -t httpd_sys_content_t /mnt/shared/logs

Because the log server will not share any data through NFS and will offer no service by means of portmap, you will be able to deactivate the nfslock service.

[root@server ~]# service nfslock stop

[root@server ~]# chkconfig nfslock off

If you want to mount the NFS remote directory from client by hand, run the following order.

[root@server ~]# mount -t nfs -o soft,intr client.local:/var/log /mnt/shared/logs

And for the case of Samba.

[root@server ~]# mount -t cifs -o username=samba_logs,password=xxxxxx,soft //client.local/logs /mnt/shared/logs

The problem of mounting a remote directory statically is that the traffic passed down over the network is also increased, since when a file is updated, it is refreshed in the destination in the same way.

Moreover, you have to take into account another severe problem related to mount file systems via Samba, and is that if the connection is cut off (restarted, some network problem, etc.), Samba does not reconnect and the mount point can remain in an unstable state, thereby any existing synchronization would be lost. Thus, it is really important to always mount file systems by using automount.

Automount is a useful tool which takes care of mounting a directory when it is really accessed. It has got a timeout (600 sg by default) that when it is completed, the directory is automatically unmounted. This situation leads to reduce the network traffic (there may be long periods where you are not accessing the shared space) and avoid loss of synchronization. Also say that automount is managed by the autofs daemon.

This is the configuration used by automount to mount the log directory from client.

[root@server ~]# yum install autofs

[root@server ~]# vim /etc/auto.master
...
/mnt/shared/logs    /etc/auto.logs   -g,--timeout=300

[root@server ~]# cat /etc/auto.logs 
nfs    -fstype=nfs,soft,intr    client.local:/var/log
samba  -fstype=cifs,username=samba_logs,password=xxxxxx,iocharset=utf8,soft    ://client.local/logs

[root@server ~]# chmod 600 /etc/auto.logs

[root@server ~]# service autofs restart

The soft option is used for an application which is trying to access the shared area does not keep blocked if the connection is lost, and brings the control back to the system after 0.7 sg. With intr, allows the user to send an interruption signal if the application which uses NFS hangs.

If instead of hooking up to a Linux machine via Samba you have a Windows machine inside a domain, you would have to specify the domain name through the domain parameter.

Also mention that when you are mounting a directory from a Windows server, it might happen that strange characters turn up. This is due to the character conversion. So as to fix it, you have to use the iocharset=utf8 option for each mount point.


Aug 5, 2012

Remote log server via HTTP (II)

Let's keep on with the second article about setting up a Remote log server via HTTP. In the preceding part, the NFS daemon was configured in order to be able to export the local log server through NFS, and all this correctly secured by iptables and TCP wrappers. In this article, I am going to continue with the configuration of Samba.

First up, a new user called samba_logs will be adding to the system. From this user, the server machine will be able to hook up to the log directory via Samba. This user will not have neither a personal directory within home nor a shell.

[root@client ~]# useradd -d /dev/null -s /sbin/nologin samba_logs

In turn, this user will also be used to create an ACL (Access Control List) on the /var/log directory, granting read permissions to that user.

[root@client ~]# setfacl -R -m d:u:samba_logs:r /var/log/

[root@client ~]# getfacl /var/log/
...
default:user:samba_logs:r--
...

Then the samba package will be installed and configured.

[root@client ~]# yum install samba

[root@client ~]# cat /etc/samba/smb.conf
[global]
...
     hosts allow = 192.168.1.
...
[logs]
     comment = Log directory
     path = /var/log
     read only = yes
     valid users = samba_logs

Finally, the samba service will be restarted and marked as persistent. Furthermore, the user will be added to the local smbpasswd file.

[root@client ~]# service smb restart

[root@client ~]# chkconfig smb on

[root@client ~]# smbpasswd -a samba_logs

So as to shield the server by iptables, the following rules will be set into the /etc/sysconfig/iptables file (Samba uses the ports 137, 138 and 139 TCP/UDP).

[root@client ~]# cat /etc/sysconfig/iptables
...
-A RH-Firewall-1-INPUT -s server.local -p tcp --dport 137:139 -j ACCEPT
-A RH-Firewall-1-INPUT -s server.local -p udp --dport 137:139 -j ACCEPT
...

[root@client ~]# service iptables restart

Remember that is important to keep SELinux and TCP wrappes on. In order SELinux to let read the exported files, it is necessary to activate the variable samba_export_all_ro.

[root@client ~]# getenforce
Enforcing

[root@client ~]# setsebool -P samba_export_all_ro on

And below you can observe the configuration for iptables.

[root@client ~]# cat /etc/sysconfig/iptables
...
-A RH-Firewall-1-INPUT -s server.local -p tcp --dport 137:139 -j ACCEPT
-A RH-Firewall-1-INPUT -s server.local -p udp --dport 137:139 -j ACCEPT
-A RH-Firewall-1-INPUT -s server.local -p tcp --dport 445 -j ACCEPT
...

Now we can try out that everything is properly configured by running the next command on server.

[root@server ~]# yum install samba-client cifs-utils

[root@server ~]# smbclient -U samba_logs -L client.local
Enter samba_logs's password: 
Domain=[MYGROUP] OS=[Unix] Server=[Samba 3.5.10-125.el6]

    Sharename       Type      Comment
    ---------       ----      -------
    logs            Disk      Log directory
    IPC$            IPC       IPC Service (Samba Server Version 3.5.10-125.el6)
    samba_logs      Disk      Home Directories
Domain=[MYGROUP] OS=[Unix] Server=[Samba 3.5.10-125.el6]

    Server               Comment
    ---------            -------

    Workgroup            Master
    ---------            -------


Jul 29, 2012

Remote log server via HTTP (I)

When you have a network with multiple servers which can be accessed by several people, for example in order to take a look at their log files, it is desirable to centralize this task on a single machine which is the common point of access for all. In this way, you will improve aspects related to the security of your infrastructure:

  • Those people will not directly log on the servers.
  • It will be possible to create a copy of the most important log files in real time.

The schema that I am going to follow so as to develop this series of articles is based on a couple of Linux servers (CentOS 6.3). The first computer, client, will be the machine which will export their log files, either by means of NFS or Samba. And the second one, server, will be the machine will import those log files and will put forward them via HTTP.

In addition, the log server will carry out a backup each five minutes of the log files through rsync. The aim of backing up is to be able to have a copy of the log files in case of one of the servers was messed up and it was impossible to reach it.

NFS is a protocol belonging to the application level and used to share volumes between several computers within a network. In return, Samba is an implementation from the SMB (Server Message Block) protocol for Linux machines, renamed to CIFS (Common Internet File System) later, which allows to share resources (directories, printers, etc.) between different computers, authenticate connections to Windows domains, provide Windows Internet Naming Service (WINS), work as PDC (Primary Domain Controller), and so on.

Using either protocol has its advantages and disadvantages. For this reason, it will be exposed in this articles both protocols. Basically, NFS does not use users and passwords like Samba, but that the only way to perform an access control is through IP addresses or host names. On the other hand, in order to share files across a local area network, NFS can be enough.

First of all, let's register the names of all implicated nodes inside the file /etc/hosts.

[... ~]# cat /etc/hosts
...
192.168.1.10 server  server.local
192.168.1.11 client  client.local

In this first article, we are going to set out by configuring NFS in the client machine. You will have to make sure to grant read permissions for all users to those elements you want to export.

[root@client ~]# chmod -R o+r /var/log/

Now you have to set up NFS in order to make public the previous directory. Afterwards, the NFS daemon will have to be started and enabled.

[root@client ~]# cat /etc/exports
/var/log/       server.local(ro,sync,root_squash)

[root@client ~]# service nfs restart ; chkconfig nfs on

As you can see, by means of the file /etc/exports it has been indicated that the /var/log directory just will be able to be mounted by server.local in read-only mode (ro). Furthermore, requests only will be replied after the changes have been committed to stable storage (sync) and those of them which came from root, will be mapped to anonymous (root_squash).

In order to secure this server, you can begin with TCP wrappers, thus you have to allow both portmap (converts RPC program numbers into Internet port numbers) and mountd (answers a client request to mount a file system) services only for the IP address where they will be listening to.

[root@client ~]# cat /etc/hosts.deny
ALL: ALL

[root@client ~]# cat /etc/hosts.allow
sshd: ALL
portmap: server.local
rpcbind: server.local
mountd: server.local

So as to the NFS service can be protected by iptables, you will have to add the following lines to the /etc/sysconfig/nfs file (by default, NFS establishes the link through a random port).

[root@client ~]# cat /etc/sysconfig/nfs
...
MOUNTD_PORT="4002"
STATD_PORT="4003"
LOCKD_TCPPORT="4004"
LOCKD_UDPPORT="4004"
RQUOTAD_PORT="4005"

[root@client ~]# service nfs restart

It happens that in NFSv4, the only ports that you need to open are 2049 TCP and 111 UDP. But in order to protect NFSv3 and NFSv2 by a firewall, as well as to be able to use the showmount command, you need to open the previous ports.

Now you have to add the corresponding rules to the iptables configuration file.

[root@client ~]# cat /etc/sysconfig/iptables
*filter
:INPUT ACCEPT [0:0]
:FORWARD ACCEPT [0:0]
:OUTPUT ACCEPT [0:0]
:RH-Firewall-1-INPUT - [0:0]
-A INPUT -j RH-Firewall-1-INPUT
-A FORWARD -j RH-Firewall-1-INPUT
-A RH-Firewall-1-INPUT -i lo -j ACCEPT
-A RH-Firewall-1-INPUT -m state --state ESTABLISHED,RELATED -j ACCEPT
-A RH-Firewall-1-INPUT -p icmp -j ACCEPT
-A RH-Firewall-1-INPUT -p tcp --dport ssh -j ACCEPT
-A RH-Firewall-1-INPUT -s server.local -p tcp --dport 111 -j ACCEPT
-A RH-Firewall-1-INPUT -s server.local -p udp --dport 111 -j ACCEPT
-A RH-Firewall-1-INPUT -s server.local -p tcp --dport 2049 -j ACCEPT
-A RH-Firewall-1-INPUT -s server.local -p udp --dport 2049 -j ACCEPT
-A RH-Firewall-1-INPUT -s server.local -p tcp --dport 4002:4005 -j ACCEPT
-A RH-Firewall-1-INPUT -s server.local -p udp --dport 4002:4005 -j ACCEPT
-A RH-Firewall-1-INPUT -j LOG
-A RH-Firewall-1-INPUT -j REJECT
COMMIT


[root@client ~]# service iptables restart

[root@client ~]# chkconfig iptables on

Also remember that it is really important to have SELinux enabled and running in enforcing mode.

[root@s1 ~]# getenforce
Enforcing

And finally, let's try out the directories exported by client from the server machine.

[root@server ~]# showmount -e client.local
Export list for client.local:
/var/log server

Jul 21, 2012

Hooking up Thunderbird to Exchange via DavMail (III)

Let's ending up the series of articles about Hooking up Thunderbird to Exchange via DavMail (I, II). Through this final part, I am going to configure Lightning as a calendar connected to Microsoft Exchange. We are talking about an extension that adds calendar functionality to Thunderbird, and allows you to create your own calendars, subscribe to another calendars and manage your own schedule.

First of all, you have to download the add-on related to this feature. In my case for example, I am using Thunderbird 14.0 on Ubuntu 12.04. Thereby, I have had to grab Lightning 1.6. Don't worry about future Thunderbird updates, since you will automatically be informed about this issue and will have the option to upgrade to a supported version of Lightning.

After downloading Lightning, go to Tools, Add-ons and select Install Add-on From File. Choose the file previously downloaded and restart Thunderbird. Now you are ready to add and configure a new calendar. For this purpose, go to File, New, Calendar and fulfil the wizard. In the first screen, pick out On the Network, and in this way your calendar will be able to be stored on a server so as to access it remotely.

In the next screen, select CalDAV as Format and for Location, type the URL http://localhost:1080/users/ followed by your email address.


And finally, you can give a name to your calendar. After this step, a pop-up will request you about a username and password for your account.

Lastly, your new calendar will be correctly hooked up to Microsoft Exchange and prepared to be used from now on.


Jul 9, 2012

Hooking up Thunderbird to Exchange via DavMail (II)

This is the second part of the article about Hooking up Thunderbird to Exchange via DavMail (I). During the first one, it was put forward how to configure DavMail so as to work as gateway between Thunderbird and Microsoft Exchange. The next step is to set up Thunderbird in order it to point to the new services that remain listening through DavMail.

You can appreciate by means of the following figure that, the credentials for the email account and the address and port where the services started in DavMail are running, have been set.


And finally, you can add a LDAP directory to be able to look up people from your company. For this purpose, open the Address Book and go to File, New, LDAP Directory, and fill in the information required for the directory server.


If you want Thunderbird to automatically search for possible addresses (in the LDAP server previously configured) when you are composing an email and typing the recipient, enable the next option in Thunderbird Preferences.


Jun 23, 2012

Hooking up Thunderbird to Exchange via DavMail (I)

I wanted to write down a good way to set up Thunderbird so as to fully work with Microsoft Exchange, since this is the typical situation that many people have to overcome in Windows environments. The solution is going to be made up by DavMail as a gateway connected to Exchange, and Lightning, a Mozilla extension aimed at providing users of Thunderbird an integrated calendaring and task management tool, which may perfectly compete with Microsoft Outlook.

DavMail is a POP, IMAP, SMTP, Caldav, Carddav and LDAP gateway which allows users to use any mail or calendar as a client (for instance Thunderbird or Lightning) with an Exchange server. The unique requirement is that OWA (Outlook Web Access) or EWS (Exchange Web Services) is enabled on Exchange.

First of all, let's get started by installing DavMail (3.9.8) on Ubuntu 12.04. DavMail is not included on the official Ubuntu repositories but you can grab it from its web page. Also mention that DavMail needs Java to work.

javi@ubuntu:~$ sudo aptitude install openjdk-6-jre libswt-gtk-3-java

javi@ubuntu:/tmp$ sudo dpkg -i davmail_3.9.8-1921-1_all.deb

Now you have to run DavMail and configure it. In my case for example, I have enabled IMAP (1143), SMTP (1025), HTTP (1080) and LDAP (1389). In addition, I have also fulfilled the URL of the server (OWA).


If you want to modify the configuration of DavMail later (there is a problem with the notification icon in this version of Ubuntu in order to open the graphical screen again), you have to edit the davmail.properties file. Also say that you can check out now the new services started.

javi@ubuntu:~$ ls -l /home/javi/.davmail.properties 
-rw-rw-r-- 1 javi javi 1471 Jun 18 19:36 /home/javi/.davmail.properties

javi@ubuntu:~$ netstat -natp | grep LISTEN | grep java
(Not all processes could be identified, non-owned process info
 will not be shown, you would have to be root to see it all.)
tcp6       0      0 :::1389                 :::*                    LISTEN      2771/java       
tcp6       0      0 :::1143                 :::*                    LISTEN      2771/java       
tcp6       0      0 :::1080                 :::*                    LISTEN      2771/java       
tcp6       0      0 :::1025                 :::*                    LISTEN      2771/java

To automatically start DavMail during the booting of your Desktop, you have to set it up by adding a startup program.


Jun 17, 2012

Apache performance tuning: security (II)

This is the second part of the article Apache performance tuning: security (I).

Disable DNS reverse

Apache has a special directive, HostnameLookups, that if it is set on, the web server will always try to resolve the IP address for each connection. This situation adds an unnecessary overload to the system, because if you need to know the names of the machines involved, you can use the logresolve tool later.

[root@localhost ~]# cat /etc/httpd/conf/httpd.conf
...
HostnameLookups Off
...

Unnecessary information provided by Apache

Disable the information introduced by Apache about its version and the kind of operating system on where it is running, both HTTP response headers from the server and error messages.

[root@localhost ~]# cat /etc/httpd/conf/httpd.conf
...
ServerTokens Prod
ServerSignature Off
...

Customize error messages

By using the ErrorDocument directive, you can pick out which error message should be showed the client when a particular error takes place.

[root@localhost ~]# cat /etc/httpd/conf/httpd.conf
...
ErrorDocument 404 "Error 404 !!!"
ErrorDocument 500 /error_500.html

Limit HTTP access methods

The HTTP protocol defines eight different methods: GET, POST, CONNECT, etc. You can use the Limit directive in order to restrict the effect of the access controls to the aforementioned HTTP methods, for instance avoiding that one of this methods works on a directory or virtual host.

[root@localhost ~]# cat /etc/httpd/conf/httpd.conf
...
<Limit POST>
    Order deny,allow
    Deny from all
</Limit>
...

The preceding configuration will not allow to upload any file to the server, returning a 403 Forbidden error if you try it.

Set the right permissions to the Apache binary

Every user who is not the owner or does not belong to the Apache group, cannot access the Apache executable file.

[root@localhost ~]# chown o-rwx /usr/sbin/httpd

Remove the welcome message

The welcome message is a web page which is displayed to the user when no index.html document exists in the DocumentRoot of the server, and the indexation is disabled (Options -Indexes).

[root@localhost ~]# rm /etc/httpd/conf.d/welcome.conf

Perform a security analysis through Nikto

Nikto is an open source web server scanner (developed in Perl) which carries out comprehensive tests against web servers for multiple items, including around 6400 potentially dangerous files/CGIs, checks for outdated versions of over 1200 servers, and version specific problems on over 270 servers. It also verifies for server configuration items such as the presence of multiple index files, HTTP server options, and will attempt to identify installed web servers and software.

[root@localhost ~]# wget --no-check-certificate https://cirt.net/nikto/nikto-2.1.4.tar.gz

[root@localhost ~]# tar xvzf nikto-2.1.4.tar.gz ; cd nikto-2.1.4

[root@localhost nikto-2.1.4]# ./nikto.pl -host localhost
- ***** SSL support not available (see docs for SSL install) *****
- Nikto v2.1.4
---------------------------------------------------------------------------
+ Target IP:          127.0.0.1
+ Target Hostname:    localhost
+ Target Port:        80
+ Start Time:         2012-05-32 22:16:13
---------------------------------------------------------------------------
+ Server: Apache/2.2.15 (CentOS)
+ Apache/2.2.15 appears to be outdated (current is at least Apache/2.2.17). Apache 1.3.42 (final release) and 2.0.64 are also current.
+ Allowed HTTP Methods: GET, HEAD, POST, OPTIONS, TRACE 
+ OSVDB-877: HTTP TRACE method is active, suggesting the host is vulnerable to XST
+ OSVDB-3268: /icons/: Directory indexing found.
+ OSVDB-3233: /icons/README: Apache default file found.
+ 6448 items checked: 1 error(s) and 5 item(s) reported on remote host
+ End Time:           2012-05-32 22:16:39 (26 seconds)
---------------------------------------------------------------------------
+ 1 host(s) tested

Nikto also has other useful option that you can take a look at. In addition, you can run Nikto with the "-update" option, so as to update databases and plugins from CIRT.net.

[root@localhost nikto-2.1.4]# ./nikto.pl -update


Jun 9, 2012

Cloning encrypted hard drives with Clonezilla

Clonezilla is a fantastic tool aimed at cloning hard drives and partitions, and afterwards, being able to recover them at the moment you want. It is based on several open source solutions such as partclone, partimage, ntfsclone and dd. The target of this article is to explain you why I have had to use this tool recently, :).

I have started to work in a new company last month. I received a new laptop with Windows Vista as operating system. I was working with it during the first week, then I installed Ubuntu 12.04 on a memory stick and I have been using it so far, and now, I have decided to install Ubuntu directly on the laptop.

What are the reasons? Windows Vista is terrible in order to work, spends a lot of time throughout the booting, runs very slowly and is not practical for the work that I have to carry out. Also mention that I am really surprised with Ubuntu running on a memory stick (USB 3.0), because the performance is pretty good, but the main handicap is its size (32 GB) and the requirements to work with virtual machines.

So what are the steps that I have had to follow up?

  • First of all, to make a backup of the entire disk through Clonezilla so as to be able to bring it back later.
  • Secondly, to convert the Windows installed on the laptop into a virtual machine by means of VMware Converter.
  • And finally, to install Ubuntu on the laptop. I also have installed VMware Player in order to be able to run that VM.

So as to clone the hard disk, I downloaded Clonezilla (1.2.12-60) and burned it on a memory stick, by means of UNetbootin, to be able to create a bootable USB flash drive. Once I had a Clonezilla Live media, I booted it on my laptop.


After booting Clonezilla, choosing the language and the keyboard layout (don't touch keymap), you have to select the option of Start_Clonezilla and device-image, in order to clone the disk by using an image.

Before cloning, you have to assign where the Clonezilla image will be saved to. In my case for example, I chose local_dev because I wanted to store the image on a external disk. For this purpose and after pressing the Ok button, I inserted the USB device into the laptop, and the operating system automatically detected the USB disk and mounted it as /home/partimag.

Then, I had to pick out the partition of the external USB hard drive where I wanted to mount the aforementioned directory.

On the next screen, the first time that I run Clonezilla I chose Beginner mode, so as to accept the default options. That was an error because Clonezilla was not able to recognize the file system used on the disk (as I mentioned before, it was cyphered), and it failed. Therefore, I had to select the other one, Expert mode, and in this way I was able to make the copy by fitting different parameters.

The following step is to choose the option savedisk, to be able to store the local disk as an image. Then you have to input a name for the saved image and select the source disk that you want to back up.

Now you get to the Clonezilla advanced extra parameters, whereby you can decide what cloning programs and priorities you prefer. Because the hard drive was encrypted, I had to pick out the "-q1" option, in order to only use dd to clone the disk.

The next screen allows you to set various parameters about the cloning method (I left the options which come by default). And finally, you have to select the compression option. I went with the last choice, -z0 (no compression), because I preferred to manually compress it after the cloning. Below you can appreciate the command executed (bzip2 compression).

$ tar cvjf 2012-06-08-ec-img.tbz2 /media/707f1d41-f3b5-4658-aa6f-c77a7cda380a/2012-06-08-ec-img

And this is the structure of files generated by Clonezilla.

$ ls -lh /media/707f1d41-f3b5-4658-aa6f-c77a7cda380a/2012-06-08-ec-img/
total 233G
-rw-r--r-- 1 root root   69 jun  8 20:18 clonezilla-img
-rw-r--r-- 1 root root    4 jun  8 20:18 disk
-rw-r--r-- 1 root root 8,1K jun  8 20:18 Info-dmi.txt
-rw-r--r-- 1 root root  22K jun  8 20:18 Info-lshw.txt
-rw-r--r-- 1 root root 4,0K jun  8 20:18 Info-lspci.txt
-rw-r--r-- 1 root root  171 jun  8 20:18 Info-packages.txt
-rw-r--r-- 1 root root    5 jun  8 20:18 parts
-rw------- 1 root root 233G jun  8 20:18 sda1.dd-img.aa
-rw-r--r-- 1 root root   37 jun  8 19:18 sda-chs.sf
-rw-r--r-- 1 root root 1,0M jun  8 19:18 sda-hidden-data-after-mbr
-rw-r--r-- 1 root root  512 jun  8 19:18 sda-mbr
-rw-r--r-- 1 root root  261 jun  8 19:18 sda-pt.parted
-rw-r--r-- 1 root root  259 jun  8 19:18 sda-pt.sf


May 31, 2012

Apache performance tuning: security (I)

Let's get started by remembering the series of articles published about Apache performance tuning:

  • Apache performance tuning: dynamic modules (I and II).
  • Apache performance tuning: directives (I and II).
  • Apache performance tuning: benchmarking (I)

In this post, I am going to talk about the points related to security, which you have to take into account when you are setting up an Apache installation.

Restrictions for the Apache user

The Apache user must not be able to log into the system. If you take a look at both passwd and shadow files, you will be able to appreciate that no shell is assigned to him (/sbin/nologin), and the field reserved for the password will contain "!!". That means that the Apache user will not be able to log on the system (he is blocked).

[root@localhost ~]# cat /etc/passwd | grep apache
apache:x:48:48:Apache:/var/www:/sbin/nologin

[root@localhost ~]# cat /etc/shadow | grep apache
apache:!!:15490::::::

Restrictions for the system root

You have to prevent that the system root (/) is accessible through the web server. It is also better to disable all options on the root directory (Options none)  and control what directives can be used in the .htaccess file by means of the AllowOverride directive.

[root@localhost ~]# cat /etc/httpd/conf/httpd.conf
...
<Directory />
    Order deny,allow
    Deny from all
    Options none
    AllowOverride none
</Directory>
...

If you define the root directory with these characteristics, then you will have to add to each directory the allowed options.

Hiding a directory or a file

Perhaps you can have a directory completely indexed and in turn, it contains different subdirectories, but you do not want to make visible a concrete directory (hidden) and you desire that it is reachable only when you type its URL. For this purpose, you have to use the IndexIgnore option.

[root@localhost ~]# cat /etc/httpd/conf/httpd.conf
...
<Directory "/var/www/html/data">
    Options Indexes
    IndexIgnore status
    IndexIgnore *.bpm
    ...
</Directory>
...

In the previous example, Apache will keep hidden the status directory and all files with bmp extension included in the /var/www/html/data directory.


May 21, 2012

Maintaining packages on Debian/Ubuntu (II)

Let's end up the last part of the article about Maintaining packages on Debian/Ubuntu. In the previous writing and by means of the dh_make utility, I set up the necessary structure to create the final package later.

The most important file of that structure is control, which provides information about the package. Also pay attention to the postinst.ex and preinst.ex files, which can include shell scripts run after or before installing the package, and postrm.ex and prerm.ex, executed after or before uninstalling the application.

root@ubuntu-server:/tmp/nano/nano-2.2.6# cat debian/control 
Source: nano
Section: unknown
Priority: extra
Maintainer: root <root@ubuntu-server.local>
Build-Depends: debhelper (>= 8.0.0), autotools-dev
Standards-Version: 3.9.2
Homepage: <insert the upstream URL, if relevant>
#Vcs-Git: git://git.debian.org/collab-maint/nano.git
#Vcs-Browser: http://git.debian.org/?p=collab-maint/nano.git;a=summary

Package: nano
Architecture: any
Depends: ${shlibs:Depends}, ${misc:Depends}
Description: <insert up to 60 chars description>
 <insert long description, indented with spaces>

And lastly, we just have to develop the deb package through dpkg-buildpackage, a program which automates the process of making a Debian package. First up, it prepares the build context by setting different environment variables. Then, it checks that the build dependencies and conflicts are satisfied, and finally, generates the deb package.

root@ubuntu-server:/tmp/nano/nano-2.2.6# dpkg-buildpackage
...
dpkg-deb: building package `nano' in `../nano_2.2.6-1_i386.deb'.
 dpkg-genchanges  >../nano_2.2.6-1_i386.changes
dpkg-genchanges: including full source code in upload
 dpkg-source --after-build nano-2.2.6
dpkg-buildpackage: full upload (original source is included)

Below you can see the package which has been turned out.

root@ubuntu-server:/tmp/nano/nano-2.2.6# file ../nano_2.2.6-1_i386.deb 
../nano_2.2.6-1_i386.deb: Debian binary package (format 2.0)

If you want to verify that this package has been correctly created, you can use the lintian tool, which dissects Debian packages and reports bugs and policy violations.

root@ubuntu-server:/tmp/nano/nano-2.2.6# lintian -i ../nano_2.2.6-1_i386.deb

Now you have to take into account that when you distribute this package on the target machine, you have to hold the package available in the official repository, that is, cancel any active installation, upgrade, or removal, and prevent in this way that this package is automatically updated in the future.

root@target:~# aptitude hold nano

root@target:~# aptitude show nano
Package: nano                            
State: installed [held]
...


May 15, 2012

Maintaining packages on Debian/Ubuntu (I)

When you have to take care of a production environment, it is normal to use distributions such as Debian, Ubuntu Server, RHEL or CentOS, because they are supported for a long time. In this way, for example, if your infrastructure is made up by Ubuntu Server LTS (Long Term Support) machines, they will be supported during five years. What does it mean? Throughout this period of time, your servers will be able to receive security updates and bug fixes.

What happens with this model? You will have to use the same version for most applications during that time. For instance, the official version of PHP that will be supported by Ubuntu Server 12.04 LTS in that term will be 5.3.10. That is to say, during this period of support, Canonical only will provide security updates and bug fixes for that package. Sometimes, some versions are updated or new features are introduced to the release, but it is not the normal behaviour.

In these cases, you will have to maintain the package versions that are not supported by the official distribution. In this article, I am going to talk about the particular situation of Ubuntu or Debian. For my tests, I will use an Ubuntu Server 12.04 virtual machine and the application chosen as an example will be the text editor nano.

So the idea of manually maintaining a package is to grab its source code, drop it off in the machine where we want to compile it (for example a 32-bit server), install the dependencies for that application, modify its configure file and finally, build the deb package. Afterwards, you will be able to distribute the package to the rest of servers by using tools such as Puppet.

First of all, let's get started by installing the needed applications to automatically make packages. Then, the source code of nano will be downloaded and unpacked.

root@ubuntu-server:~# aptitude install build-essential dh-make devscripts autoconf autotools-dev lintian

root@ubuntu-server:~# mkdir /tmp/nano ; cd /tmp/nano

root@ubuntu-server:/tmp/nano# wget http://www.nano-editor.org/dist/v2.2/nano-2.2.6.tar.gz

root@ubuntu-server:/tmp/nano# tar xvzf nano-2.2.6.tar.gz ; cd nano-2.2.6

Then, you have to install the dependencies required to compile the application: the developer's libraries for ncurses and the texinfo package (documentation system for on-line information and printed output).

root@ubuntu-server:/tmp/nano/nano-2.2.6# aptitude install libncurses-dev texinfo

At this time, you are ready to prepare Debian packaging from an original source archive, all this by means of dh_make, a tool which allows to convert a regular source code package into one formatted, according to the requirements of the Debian policy. It must be invoked inside a directory containing the source code, which has to be named <packagename>-<version>, where <packagename> must be all lowercase, digits and dashes.

root@ubuntu-server:/tmp/nano/nano-2.2.6# dh_make -e root@ubuntu-server.local -f ../nano-2.2.6.tar.gz 

Type of package: single binary, indep binary, multiple binary, library, kernel module, kernel patch?
 [s/i/m/l/k/n] s

Maintainer name  : root
Email-Address    : root@ubuntu-server.local 
Date             : Sat, 12 May 2012 18:56:39 +0200
Package Name     : nano
Version          : 2.2.6
License          : blank
Type of Package  : Single
Hit <enter> to confirm: 
Done. Please edit the files in the debian/ subdirectory now. nano
uses a configure script, so you probably don't have to edit the Makefiles.

After that, dh_make proceeds to generate a Debian subdirectory and the necessary control files in the program source directory. Those control files are customized with the package name and version extracted from the directory name. In addition, a new tgz file with the original program source code and packed with the Debian standards is created.

root@ubuntu-server:/tmp/nano/nano-2.2.6# ls -lh ../nano_2.2.6.orig.tar.gz 
-rw-r--r-- 1 root root 1.5M Nov 22  2010 ../nano_2.2.6.orig.tar.gz

root@ubuntu-server:/tmp/nano/nano-2.2.6# tree debian
debian
├── changelog
├── compat
├── control
├── copyright
├── docs
├── emacsen-install.ex
├── emacsen-remove.ex
├── emacsen-startup.ex
├── info
├── init.d.ex
├── manpage.1.ex
├── manpage.sgml.ex
├── manpage.xml.ex
├── menu.ex
├── nano.cron.d.ex
├── nano.default.ex
├── nano.doc-base.EX
├── postinst.ex
├── postrm.ex
├── preinst.ex
├── prerm.ex
├── README.Debian
├── README.source
├── rules
├── source
│   └── format
└── watch.ex

1 directory, 26 files