Dec 28, 2010

Proxmox Virtualization Environment

Proxmox VE is an open source virtualization platform based on Linux and used to run virtual appliances and virtual machines. It is a product aimed at companies and production environments, since it intends to be an easy deployment and management solution.

Proxmox VE supports three types of virtualization technologies:

  • Container virtualization (OpenVZ): it allows that a physical server can run multiple insolated operating system instances as well known as containers. Its main problem is these containers or guests can just be Linux instances. However, the OpenVZ kernel provides better performance (penalty between 1% and 3% compared to a standalone server) in contradistinction to other alternatives.

  • Full virtualization (KVM): it can run Linux and Windows guests but unlike OpenVZ, Intel VT or AMD-V CPU is needed.

  • Paravirtualization (KVM): it presents a software interface similar to the underlying hardware in order to try to reduce the execution time of certain operations.

In my personal opinion, I think that OpenVZ is a plus because it has got better performance than KVM and the containers idea is fantastic: the size of these templates is really small and you can get a ready virtual machine in few minutes.

You can install Proxmox VE from an ISO image or directly on an existing Debian distribution (32 or 64 bits). I have tested Proxmox VE 1.7 (bare-metal ISO installer based on Debian Lenny) on a KVM virtual machine under my Kubuntu 10.10.

The process is very simple. The Proxmox installer is based on a graphical wizard with several stages: location and time zone selection, password and email address definition, and network configuration.

What are the main features of this product?

  • Web based administration: easy deployment and management (web based management and virtual console, backup and restore with LVM2 snapshots, etc.).

  • Virtual appliances: they are fully pre-installed and pre-configured applications including the operating system environment. You can create your own container, get from the community, use Linux OS instances or buy certified appliances.

  • Proxmox VE cluster: it allows to gather multiple physical server in one VE cluster (central web management and login, cluster synchronization, easy cluster setup, live migration of virtual machines between physical servers, etc.).

When you finish the installation process, you must reboot the machine and update the system.

proxmox:~# aptitude update ; aptitude dist-upgrade

In order to manage Proxmox VE, you must open a web browser and type the IP address configured during the wizard (the default user is 'root').


The Proxmox web interface is very useful. It is formed by three principal sections, VM Manager, Configuration and Administration.

In the VM Manager area, you can upload ISO images and OpenVZ templates, download certified appliances and create and handle virtual machines.

In the Configuration area, you can set up the different parameters of the system (network, DNS, time, administrator options, language, proxy, etc.), add and manage data storages (ISCSI targets, NFS shares, LVM groups and directories) and create new backup jobs.

And finally, in the Administration area you can control the Proxmox VE certificates and services (ClusterSync, ClusterTunnel, NTP, SMTP, SSH and WWW), take a look at the logs and monitor the cluster nodes.


Dec 22, 2010

Frag needed and DF set

I was remembering a curious problem that we had at work the last year.

There was an HTTPS service that when you tried to access it by means of a web browser, the screen did not show anything. The display was blank waiting...

The main inconvenience was that we had not access to the web server to check it out. At that moment, I ran a tcpdump on the client in order to capture all network traffic and try to find out what was happening.

When I analyzed the packets I could see that the TCP connection was established correctly but then, the web server was sending frames with "TCP Previous segment lost", "TCP Dup ACK", "TCP Retransmission" messages. It is a pity because I do not keep these network captures to output them here...

Well, then it was clear that there was some device in the middle of the route between client and server, which was causing a leak of network packets in that communication.

Our network architecture was similar to the schema of the following image.


Taking a look at the firewall logs, we could see that there were ICMP packets related to the problematic HTTPS connection which were being dropped.

The router was sending ICMP packets (type 3, destination unreachable - code 4, fragmentation needed) to the source, in order to warn it that its MTU was smaller than the size of the packets, and on top of all that, the DF (prohibit fragmentation) was set to 1.

When that ICMP packet reached to the firewall, it was dropped and the source never knew that it had to reduce the data field for the TCP/IP packets. The solution was to allow the ICMP traffic (ICMP protocol with type 3 and code 4).

We can realize a little test in our computer. For example, attempting to send a packet whose size exceeds our network MTU (1500) and besides, DF=1 (192.168.1.100 is my PC and 192.168.1.1 the destination).

javi@kubuntu:~$ ping -c 1 -s 2000 -M do 192.168.1.1 PING 192.168.1.1 (192.168.1.1) 2000(2028) bytes of data.
From 192.168.1.100 icmp_seq=1 Frag needed and DF set (mtu = 1500)

If I run a tcpdump, I can see that I receive an ICMP datagram noting me that I have to lower the size of the packets.

javi@kubuntu:~$ sudo tcpdump -ni lo icmp -s0
tcpdump: verbose output suppressed, use -v or -vv for full protocol decode listening on lo, link-type EN10MB (Ethernet), capture size 65535 bytes
18:59:33.014773 IP 192.168.1.100 > 192.168.1.100: ICMP 192.168.1.1 unreachable
- need to frag (mtu 1500), length 556


Dec 13, 2010

Linux load average

I wanted to write an article about a topic that over time, it is still generating much confusion: the load average.

The system load average is a set of three numerical values which are provided by tools such as uptime or top. These values represent the average number of system processes that during the last 1, 5 and 15 minutes have been waiting for any resource of the system (CPU, disk access, network, etc.)

[root@centos ~]# uptime
15:43:45 up 9 days,  5:19,  1 user,  load average: 1.62, 1.49, 1.39

[root@centos ~]# top
top - 15:44:32 up 9 days,  5:20,  1 user,  load average: 1.38, 1.43, 1.37
...

In the previous output of the uptime command, 1.49 means that during the last 5 minutes, an average of 1.49 processes have been blocked waiting for some resource allocation.

For instance, I usually set a trigger in Zabbix for when the average load during the last 5 minutes has been higher than the number of cores available on the monitored machine.

When an alarm of this type is raised, does not necessarily have to mean that the CPU is overloaded. At that moment we have to use other Linux tools, such as top, vmstat, iostat, vnstat, etc, in order to find out what process or processes are involved and what resources are affected.

Finally, to emphasize the word of the title (Linux...), since these values for UNIX systems represent the number of processes which have utilized (running) the CPU or have been expecting for it (runnable).


Dec 7, 2010

KVM virtualization on Ubuntu (IV)

This is the last article about KVM virtualization on Ubuntu (I, II, III).

In the first post, I choose as hypervisor localhost (QEMU). If you pick out the other hypervisor available (localhost (QEMU Usermode)) and try to set up a virtual machine, in the last step you will get an error with the following text: "Imposible completar la instalación: «internal error Process exited while reading console log output: char device redirected to /dev/pts/1 qemu: could not open disk image /var/lib/libvirt/images/Ubuntu.img: No such file or directory".


The problem is when you select this hypervisor, the virtual machine is created with your user account, and if you take a look at the permissions on the /var/lib/lubvirt/images directory, you will see that only the root user can write in it.

javi@javi-kubuntu:~$ ls -l /var/lib/libvirt/
total 12
drwxr-xr-x 2 root         root 4096 2010-09-25 00:52 boot
drwxr-xr-x 2 root         root 4096 2010-09-25 00:52 images
drwxr-xr-x 4 libvirt-qemu kvm  4096 2010-12-07 12:28 qemu

The solution consists in changing the directory from root to libvirtd group and adding write permissions.

javi@javi-kubuntu:~$ sudo chown :libvirtd /var/lib/libvirt/images

javi@javi-kubuntu:~$ sudo chmod g+w /var/lib/libvirt/images

Remember that with this sort of connection (localhost (QEMU Usermode)), the storage will be into the /var/lib/libvirt/images directory, but the configuration and log files will reside in the user home.

javi@javi-kubuntu:~$ tree .libvirt/
.libvirt/
├── qemu
│   ├── cache
│   ├── lib
│   ├── log
│   │   └── Ubuntu.log
│   ├── run
│   ├── save
│   ├── snapshot
│   └── Ubuntu.xml
└── storage
├── autostart
│   └── default.xml -> /home/javi/.libvirt/storage/default.xml
└── default.xml

During four articles, we have learnt how to make virtual machines with KVM, libvirt and Virtual Machine Manager. I still have to present several articles related to snapshots, access to hypervisors running on remote machines, types of virtual networks, etc.

KVM is a great option to handle virtual machines. It would be a good idea to carry out some tests in order to meter the performance of different types of hypervisors, such as Xen or VMware.


Nov 29, 2010

Invalid or incomplete multibyte or wide character

The other day I downloaded a video with JDownloader and when I tried to move it into my usb memory, the system did not recognize the file and it could not move it.

The error message which Linux returned was "Caracter multibyte amplio inválido ó incompleto" (I have configured my system in Spanish), "Invalid or incomplete multibyte or wide character" in English.

javi@javi-kubuntu:~$ mv .jdownloader/downloads/TICs_espa�olas.avi /media/disk-2/
mv: no se puede efectuar «stat» sobre «/media/disk-2/TICs_espa\244olas.avi»: Caracter multibyte amplio inválido ó incompleto

This is a serious problem, because in addition to not be able to copy or move the file, you can neither remove it.

The issue is that file is encoded with ISO-8859-15, and my system is configured as UTF-8. The solution consists in converting the file name encoding to UTF-8. In order to carry out this operation, we can use the convmv utility.

javi@javi-kubuntu:~$ sudo aptitude install convmv

javi@javi-kubuntu:~/.jdownloader/downloads$ convmv -f iso-8859-15 -t utf-8 TICs_espa�olas.avi
Your Perl version has fleas #37757 #49830                                                                                                                                                                                                                                
Starting a dry run without changes...                                                                                                                                                                                                                                    
mv "./TICs_espa�olas.avi"    "./TICs_espa€olas.avi"                                                                
No changes to your files done. Use --notest to finally rename the files.

The previous output shows us the final file name after the conversion. So as to apply the changes permanently, you have to add the --notest argument.

javi@javi-kubuntu:~/.jdownloader/downloads$ convmv --notest -f iso-8859-15 -t utf-8 TICs_espa�olas.avi
Your Perl version has fleas #37757 #49830                                                                                                                                                                                                                                  
mv "./TICs_�olas.avi"    "./TICs_€olas.avi"                                                                
Ready!


Nov 22, 2010

KVM virtualization on Ubuntu (III)

Let's continue exploring more stuff about KVM virtualization on Ubuntu (remember that there have been posted two previous articles, I and II). We will start with an interesting characteristic: cloning existing virtual machine images with identical virtual hardware configurations.

This is a typical operation because it is normal that we have to install several times the same operating system for different functions. For example, we can need three servers running under a Linux distribution: mail, web and data storage. For this purpose, first we would make a virtual machine with that Linux OS, then we would clone that virtual machine twice and finally, we would install the rest of services on the base systems.

The following order generates a new virtual machine named cloned_BT, from BackTrack4 domain. It is necessary to specify the hypervisor by means of the --connect parameter and to have turned the virtual machine off.

javi@javi-kubuntu:~$ virt-clone --connect qemu:///system --original BackTrack4 --auto-clone --name cloned_BT

We can also perform this task through the Virtual Machine Manager.


Other interesting feature is related to the possibility of saving a running domain into a state file, with the aim of being able to be restored later. When we execute this operation, the domain will be automatically switched off.

javi@javi-kubuntu:~$ virsh save BackTrack4 BT4.save

javi@javi-kubuntu:~$ virsh restore BT4.save

We can use for example this characteristic to back up our virtual machine before a critical task, such as a system update. Therefore if we want to restore a domain from a state file, we will add the restore option (the virtual machine must be turned off).

And finally, I will present another useful tool in order to show the state of the virtualized domains. This utility is similar to top.

javi@javi-kubuntu:~$ sudo aptitude install virt-top

javi@javi-kubuntu:~$ virt-top --connect qemu:///system
virt-top 18:01:14 - x86_64 2/2CPU 2000MHz 3961MB
2 domains, 2 active, 2 running, 0 sleeping, 0 paused, 0 inactive D:0 O:0 X:0
CPU: 1,0%  Mem: 1024 MB (1024 MB by guests)

 ID S RDRQ WRRQ RXBY TXBY %CPU %MEM    TIME   NAME                                                                                                                                                                                                                         
  1 R    0    0   52    0  0,5 12,0   0:41.37 BackTrack4
  2 R    0    0   52    0  0,5 12,0   0:30.69 UbuntuServer_10.10

We can also get certain information about a concrete virtual machine selecting the Performance console, in the Virtual Machine Manager.


Nov 13, 2010

KVM virtualization on Ubuntu (II)

In the previous article about KVM virtualization on Ubuntu (I), I exposed how to set up virtual machines with KVM. Now we will learn how to handle them, either through the command line or by means of the Virtual Machine Manager graphical tool.

First of all, we must know where are located the most important files used by KVM (configuration, virtual images and log files). We can see that the characteristics of the virtual machines are stored into XML files.

javi@javi-kubuntu:~$ ls -lh /etc/libvirt/qemu/
total 12K
-rw------- 1 root root 2,0K 2010-10-12 23:00 BackTrack4.xml
drwxr-xr-x 3 root root 4,0K 2010-10-12 18:22 networks
-rw------- 1 root root 2,0K 2010-11-06 16:08 UbuntuServer_10.10.xml

javi@javi-kubuntu:~$ ls -lh /var/lib/libvirt/images/
total 21G
-rw------- 1 root root  12G 2010-10-12 23:02 BackTrack4.img
-rw------- 1 root root 8,0G 2010-11-06 17:04 UbuntuServer_10.10.img

javi@javi-kubuntu:~$ ls -lh /var/log/libvirt/qemu/
total 12K
-rw------- 1 root root    0 2010-10-13 21:38 BackTrack4.log
-rw------- 1 root root 2,3K 2010-11-06 17:04 UbuntuServer_10.10.log

It is also important to know the basic information about the hardware (number and type of CPU, size of the physical memory, etc.) where we will create the virtual machines.

javi@javi-kubuntu:~$ virsh nodeinfo
Modelo del CPU:      x86_64
CPU(s):              2
Frecuencia de CPU:   2000 MHz
Zócalo(s) de CPU:   1
Núcleo(s) por ranura: 2
Hilo(s) por núcleo: 1
Celda(s) NUMA:       1
Tamaño de memoria:  4056208 kB

Remember that in KVM, virtual machines are also known as domains. In order to list the state (running, idle, paused, shutdown, shut off, crashed or dying) of all existing domains, we must run the following order:

javi@javi-kubuntu:~$ virsh list --all
Id Nombre               Estado
----------------------------------
- BackTrack4           apagado
- UbuntuServer_10.10   apagado

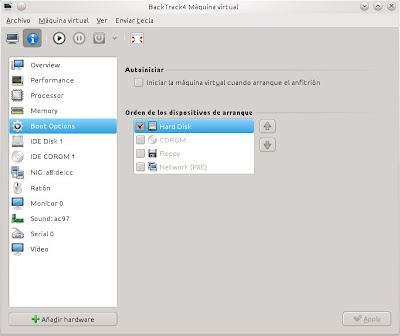
If we want to edit the features (processor, memory, boot options, disk, NICs, monitor, etc.) of a concrete domain or add new virtual hardware components (storage, network, graphics, serial, parallel, watchdog, etc.), we can use Virtual Machine Manager.


Other way to modify the details of a virtual machine can be by means of the virsh command. This option is equivalent to output the domain information as an XML dump, edit that dump file, validate the XML file and define the domain from the XML file.

javi@javi-kubuntu:~$ virsh edit BackTrack4

javi@javi-kubuntu:~$ virsh dumpxml BackTrack4 > domain.xml
javi@javi-kubuntu:~$ vi domain.xml
javi@javi-kubuntu:~$ virt-xml-validate domain.xml
javi@javi-kubuntu:~$ virsh define domain.xml

Then we are going to present the necessary commands to start an inactive domain, suspend a running virtual machine in memory, move it out of the suspended state (resume), reboot it and shut it down.

javi@javi-kubuntu:~$ virsh start UbuntuServer_10.10

javi@javi-kubuntu:~$ virsh suspend UbuntuServer_10.10

javi@javi-kubuntu:~$ virsh resume UbuntuServer_10.10

javi@javi-kubuntu:~$ virsh reboot UbuntuServer_10.10

javi@javi-kubuntu:~$ virsh shutdown UbuntuServer_10.10

Other interesting option for a specific domain is dominfo, which returns basic information about the virtual machine.

javi@javi-kubuntu:~$ virsh dominfo BackTrack4
Id:             -
Nombre:         BackTrack4
UUID:           cc951529-f630-b8ea-1da8-9a75e382190d
Tipo de sistema operatuvo: hvm
Estado:         apagado
CPU(s):         1
Memoria máxima: 524288 kB
Memoria utilizada: 524288 kB
Persistente:    sí
Autoinicio:     desactivar
Modelo de seguridad: apparmor
DOI de seguridad: 0

And finally, if we want the domain to be automatically started at boot, we must run the next order. If we want to disable this option, we must add the --disable parameter.

javi@javi-kubuntu:~$ virsh autostart BackTrack4

javi@javi-kubuntu:~$ virsh autostart --disable BackTrack4


Nov 6, 2010

KVM virtualization on Ubuntu (I)

I do not like too much Oracle, I have to recognize it, particulary its business model. For that reason, I think that I have to try (whenever I can) to use other alternative products. The future of certain applications as OpenOffice, MySQL, VirtualBox is not clear...

In this article we are going to relate how to set up virtual machines on Ubuntu with KVM. I think that KVM is the future of the virtualization in the open source world, especially because it is a technology developed by Red Hat and this company is betting very hard for it.

First of all, we have to make sure whether our hardware supports virtualization (I am going to carry out the testing on Kubuntu 10.10 64 bits). For this purpose, we must check out if the vmx or svm flags appear into the cupinfo file.

javi@javi-kubuntu:~$ cat /proc/cpuinfo | egrep "(vmx | svm)" | wc -l
2

In my case, the result is two (my processor has got two cores). Then, we have to install the necessary packages:

javi@javi-kubuntu:~$ sudo aptitude install kvm libvirt-bin virt-manager

Now, we can see a new virtual network interface (virbr0) and a new group (libvirtd) in the system. My user name has also been added to the libvirtd group.

javi@javi-kubuntu:~$ ip a
...
19: virbr0: <BROADCAST,MULTICAST,UP,LOWER_UP> mtu 1500 qdisc noqueue state UNKNOWN
link/ether 0e:af:bc:3a:c8:6a brd ff:ff:ff:ff:ff:ff
inet 192.168.122.1/24 brd 192.168.122.255 scope global virbr0
inet6 fe80::caf:bcff:fe3a:c86a/64 scope link
valid_lft forever preferred_lft forever

javi@javi-kubuntu:~$ cat /etc/group
...
libvirtd:x:124:javi

We have to restart the sesson for the user changes take effect. In order to verify that everything is right, we can type the following command:

javi@javi-kubuntu:~$ virsh -c qemu:///system list
Id Nombre               Estado
-------------------------------

Now we can create our first virtual machine opening the Virtual Machine Manager (Applications, System, Virtual Machine Manager), picking out localhost (QEMU) - Not Connected option and making double click on it (this is the hypervisor to which we connect - qemu:///system). Then we must press on Create a new virtual machine button and complete the different steps of the wizard.

Through the wizard, we will have to choose the features or resources for the virtual machine, such as the name, installation source (ISO, CD-ROM, network, PXE, importing the image, etc.), type and version of the operating system, amount of memory and CPUs, size of the virtual hard disk, etc.

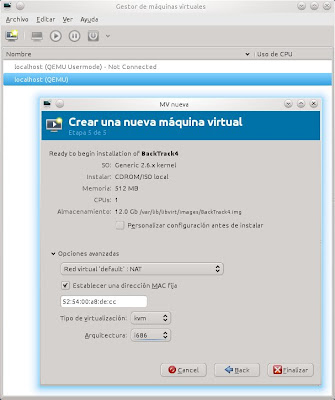
In the last step, we can see a little summary about the selected characteristics and besides, pick out the type of virtualization (kvm, qemu - we will choose kvm), the sort of architecture (x86_64 or i686 - depends on the operating system to be installed) and the kind of network (NAT by default). In future articles, I will explain how to configure different types of virtual networks.


During the virtual store step, we can select a tab about allocating all the disk size now... In my personal opinion, we must mark this option because the virtual machine performance will be better if all the disk space is reserved from the beginning.

At the end of this process, we will have a screen with the new virtual machine embedded within it and we will be able to performe several operations on it: run, pause, shut down, clone, migrate, etc.


Oct 30, 2010

Patching VMware vSphere (ESXi) with vCLI

I think that it is very important to have up to date our VMware vSphere (ESXi) systems, due to VMware periodically releases a series of patches which fixes bugs and security breaches on them.

For this purpose, we can use either vSphere Host Update Utility (graphical tool included within VMware vSphere package) or vihostupdate command, belonging to the vCLI (vSphere Command-Line Interface) enviroment, which allows us to perform several tasks (managing virtual machines, files, storages, users, etc.) remotely on VMware vSphere.

When I attempted to use vSphere Host Update Utility at work, I had problems because my PC is behind a proxy... In theory, you can set the ProxyServer tag into the settings.config file, but not working properly.

Then we are going to see how to apply a patch on VMware vSphere with vCLI. The tests will be realized on a Windows XP system, but do not worry because the commands are the same for Linux systems.

We must have installed the vCLI utility on our PC. I recommend to install vSphere CLI 4.1 version, because in this way we will be able to manage VMware vSphere 4.0 or 4.1. If we try to use vCLI 4.0 Update 1 or previous with VMware vSphere 4.1, we will get the following error: "This operation is NOT supported on 4.1.0 platform".

In this example, I am going to apply the lastest patch available (ESXi400-201009001) on a VMware vSphere 4.0 (update02) with 192.168.1.100 IP address.

First, we must open in a browser the web site with the patches available for VMware products: Download Patches. We can use the search tool to find them. In our case, we pick out the ESXi (Embedded and Installable) 4.0.0 product.

Then we access to a new screen with all patches released for our device, where we can see that they are ordered by date and version, and besides, we can take a look at their description, bulletins and classification.


In general, a patch includes one or more bulletins and it is important to know that the patches are cumulative, that is to say, a current patch contains all corrections of a previous release.

Next step is to download the patch. I usually drop it off into the same directory where are the vCLI Perl scripts.

C:\Archivos de programa\VMware\VMware vSphere CLI\bin>dir
El volumen de la unidad C no tiene etiqueta.
El número de serie del volumen es: A01F-3A26

Directorio de C:\Archivos de programa\VMware\VMware vSphere CLI\bin

28/10/2010  10:48    <DIR>          .
28/10/2010  10:48    <DIR>          ..
09/02/2010  15:59                49 .directory
20/04/2009  20:54             7.638 esxcfg-advcfg.pl
20/04/2009  20:54             8.214 esxcfg-cfgbackup.pl
20/04/2009  20:54             7.892 esxcfg-dns.pl
...
20/09/2010  04:14       184.519.878 ESXi400-201009001.zip
...

We must check out what bulletins included inside the patch can be applied to the VMware vSphere. In the present case, we figure out that there are two bulletins available.

C:\Archivos de programa\VMware\VMware vSphere CLI\bin>vihostupdate.pl --server 192.168.1.100 --scan --bundle ESXi400-201009001.zip
Enter username: root
Enter password:
The bulletins which apply to but are not yet installed on this ESX host are listed.

---------Bulletin ID---------   ----------------Summary-----------------
ESXi400-201009401-BG            Updates Firmware
ESXi400-201009402-BG            Updates VMware Tools

Now we are ready to run the order which will apply the updates. Before setting the patch, VMware vSphere must be put into maintenance mode. For that, we have to use the vSphere client and press the Enter Maintenance Mode option in the Summary tab.

C:\Archivos de programa\VMware\VMware vSphere CLI\bin>vihostupdate.pl --server 192.168.1.100 --install --bundle ESXi400-201009001.zip --bulletin ESXi400-201009401-BG,ESXi400-201009402-BG
Enter username: root
Enter password:
The update completed successfully, but the system needs to be rebooted for the changes to be effective.

The last step after rebooting the machine, is to make sure that the patch has been applied correctly.

C:\Archivos de programa\VMware\VMware vSphere CLI\bin>vihostupdate.pl --server 192.168.1.100 --query
Enter username: root
Enter password:
---------Bulletin ID--------- -----Installed----- ----------------Summary-----------------
ESXi400-Update02              2010-10-25T14:47:24 VMware ESXi 4.0 Update 2
ESXi400-201006203-UG          2010-10-25T14:47:24 VI Client update for 4.0 U2 release
ESXi400-201009401-BG          2010-10-25T15:18:23 Updates Firmware
ESXi400-201009402-BG          2010-10-25T15:18:23 Updates VMware Tools

Do not forget to exit Maintenance Mode and remember that we can also use this utility to upgrade a VMware vSphere from the 4.0 to 4.1 version.


Oct 24, 2010

MySQL optimization (IV)

This is the last article about MySQL tunning, and we are going to present the way to change the mentioned parameters. The previous issue was MySQL optimization (III).

These parameters were established into the MySQL configuration file (my.cnf). Such modifications will not take effect until the mysqld service is rebooted. But there may be the case where we cannot reset the service, for example because the computer is on a production environment.

In this situation we must know that in MySQL, there are several dynamic variables wich can be modified at runtime. In order to see all system variables, we can run the following order:

mysql> show global variables;
+---------------------------------+------------------------------------------------------------+
| Variable_name                   | Value                                                      |
+---------------------------------+------------------------------------------------------------+
| auto_increment_increment        | 1                                                          |
| auto_increment_offset           | 1                                                          |
| automatic_sp_privileges         | ON                                                         |
| back_log                        | 50                                                         |
| basedir                         | /usr/                                                      |
| bdb_cache_size                  | 8384512                                                    |
| bdb_home                        | /var/lib/mysql/                                            |
| bdb_log_buffer_size             | 262144                                                     |
...

So as to show the value of a concrete variable:

mysql> show global variables like 'table_cache';
+---------------+-------+
| Variable_name | Value |
+---------------+-------+
| table_cache   | 64    |
+---------------+-------+
1 row in set (0.00 sec)

And if we want to modify its value at runtime (it must be changed globally wherever possible):

mysql> set global table_cache=1024;
Query OK, 0 rows affected (0.00 sec)


Oct 18, 2010

Kubuntu 10.10 Maverick Meerkat

I have been testing the new distribution of Canonical, Kubuntu 10.10 Maverick Meerkat, since October 10, the day which was launched.

There are no many features in this release, but I think that Kubuntu goes on improving over and over. Now, we have got a new kernel, 2.6.35, and a new version of KDE, 4.5.1.

On the desktop, we can make out a new style for the system tray and a new Ubuntu font by default.


KPackageKit have been improved too, and now, we can filter the applications by categories, such as Accesibility, Developer Tools, Internet, etc. and for example inside Internet, we can choose Chat, File Sharing, Mail and Web Browsers.


We can also appreciate a new web browser, Rekonq, which reminds me to Google Chrome.


When I comment a new release of Kubuntu, I like to measure the boot time of the operating system on my laptop. In Kubuntu 9.10 Karmic Koala, it was 12 sg for the power on (to the kdm screen) and shutdown (from the desktop). Now it is around 9 sg for both.

Finally, also note that I had a little problem at work with the upgrade process... My computer is behind a proxy and I supposed that configuring the proxy URL (ProxyHTTP parameter) into the KPackageKit configuration file (PackageKit.conf) it would be enough... I was wrong, there must be a bug in that KPackageKit version (0.5.4) and it does not work, and therefore, you cannot update to Kubuntu 10.10 Maverick Meerkat from 10.04 Lucid Lynx behind a proxy.

The solution was to install the update-manager package and use this program to launch the upgrade task (it handles the http_proxy environment variable correctly).


Oct 10, 2010

MySQL optimization (III)

Let's go on with the series of articles about MySQL tunning. Remember that in the previous issue, MySQL optimization (II), we got going to break down the suggestions provided by the Tunning Primer Script.

Now, we are going to continue regarding the query cache, since the script shows us which is disabled (Query cache is supported but not enabled).

When a query is executed, the database engine always performs the same task: processes the query, determines how to run it, loads the information from the disk and returns the value to the client. Through this cache, MySQL saves the result of a particular query in memory, so that in many cases the system performance can be significantly improved.

In order to display the query cache status, we can run the following order:

mysql> show status like 'qcache%';
+-------------------------+-------+
| Variable_name           | Value |
+-------------------------+-------+
| Qcache_free_blocks      | 0     |
| Qcache_free_memory      | 0     |
| Qcache_hits             | 0     |
| Qcache_inserts          | 0     |
| Qcache_lowmem_prunes    | 0     |
| Qcache_not_cached       | 0     |
| Qcache_queries_in_cache | 0     |
| Qcache_total_blocks     | 0     |
+-------------------------+-------+
8 rows in set (0.00 sec)

The most important values are Qcache_free_memory (free cache memory), Qcache_inserts (insertions performed in the cache), Qcache_hits (successful insertions) and Qcache_lowmem_prunes (number of times that the cache runs out of memory and must be cleaned).

The result of Qcache_inserts/Qcache_hits division is known as percentage of losses. If the value of this ratio is for example 20%, it means that the 80% of the queries are attended from the cache.

Other important parameter is Qcache_free_blocks, which indicates us that the memory is fragmented whether it has got a high value. To defragment the non contiguous memory blocks, we can run the following command (in fact, there should be set a cron job to run this command every 4 or 8 hours).

[root@centos ~]# mysql -u root -p -e "flush query cache"

[root@centos ~]# crontab -e
0 */4 * * * mysql -u root -pxxxxxx -e "flush query cache"

The parameter wich allows us to adjust the cache size is Qcache_lowmem_prunes, since the larger it is, the more times the cache must be restarted. In order to fit the query cache size, we must set a value for the query_cache_size parameter, inside the MySQL configuration file.

[root@centos ~]# cat /etc/my.cnf
[mysqld]
...
query_cache_size  = 128M
query_cache_limit = 4M
query_cache_type  = 1

The query_cache_limit parameter establishes the maximum result wholes size stored in the query cache. If we want whenever possible a query is cached, we must activate the query_cache_type variable.

Another recommendation is related to the table cache (You should probably increase your table_cache). The table_cache variable indicates how many tables can be simultaneously opened. Each table is represented by one disk file (descriptor) and it must be opened before being read.

In order to adjust this parameter, we must take a look at the Open_tables (currently open tables) and Opened_tables (tables wich have been opened) variables.

mysql> show global status like 'open%tables';
+---------------+-------+
| Variable_name | Value |
+---------------+-------+
| Open_tables   | 64    |
| Opened_tables | 30    |
+---------------+-------+
2 rows in set (0.00 sec)

If the Opened_tables grows up very quicly, it means that are opening and closing tables for lack of descriptors. In that case, we should increase the table_cache value.

To modify this value in MySQL, we have to edit its configuration file. As well we have to take into account that this variable has to be always less than open_files_limit. Otherwise, we must change it.

And besides, we can also set the table_definition_cache variable, which represents the number of table definitions that can be stored in the definition cache (it should be normally the same as table_cache) and unlike the table_cache, it does not use file descriptors.

[root@centos ~]# cat /etc/my.cnf
[mysqld]
...
table_cache = 512
table_definition_cache = 512

open_files_limit = 1024

The script also shows us that around 30% of the temporary tables are created in the disk, with what we could increase the size of the tmp_table_size (if a temporary table in memory exceeds this size, it is automatically moved to disk) and/or max_heap_table_size (maximum value that the tables can grow up in memory) variables.

So as to set correctly these values, you can analyze the Created_tmp_disk_tables (number of temporary tables created on disk) and Created_tmp_tables (number of temporary tables created in memory).

mysql> show status like 'created_tmp%';
+-------------------------+-------+
| Variable_name           | Value |
+-------------------------+-------+
| Created_tmp_disk_tables | 0     |
| Created_tmp_files       | 5     |
| Created_tmp_tables      | 1     |
+-------------------------+-------+
3 rows in set (0.00 sec)

As you can see in the previous results, no table is made on disk, then this situation does not correspond with the 30% data provided by the script. This is due to the script does not check the real value of the temporary tables created on disk, since looking its code we can confirm that the script runs a benchmark to generate 5000 aleatory registers and measures its performance ("show /*!50000 global */ status like...").

In the MySQL configuration file, we can change the tmp_table_size and max_heap_table_size values.

[root@centos ~]# cat /etc/my.cnf
[mysqld]
...
tmp_table_size = 64M
max_heap_table_size = 32M


Oct 3, 2010

MySQL optimization (II)

Continuing with the previous article about MySQL optimization (I), we are going to start with one of the suggestions provided by the tunning-primer.sh script: The slow query log is NOT enabled.

The queries which spend a lot of CPU (its running time is very high, for example more than 5 seconds) are named slow queries, and it is appropriate to register them in order to be optimized by the developers.

Other good measure can be to activate the logging of those queries which do not use indexes, since this kind of query increases the computer resources consumption because it is necessary more time to loop through the tables. This sort of query should be treated too.

[root@centos ~]# cat /etc/my.cnf
[mysqld]
...
log-slow-queries
long_query_time = 5
log-queries-not-using-indexes

Other variable showed is related to the thread cache (thread_cache_size), which indicates us that seems to be fine.

The size of this parameter depends on the speed with which the new threads are created (Threads_created). For the case that we are discussing (Zabbix database), many threads are not generated quickly, thus we will enable this cache for safety and we will set a low value, such as 32.

[root@centos ~]# cat /etc/my.cnf
[mysqld]
...
thread_cache_size = 32

So as to display the threads state, we can run the following order:

mysql> show status like 'threads%';
+-------------------+-------+
| Variable_name     | Value |
+-------------------+-------+
| Threads_cached    | 0     |
| Threads_connected | 15    |
| Threads_created   | 23428 |
| Threads_running   | 1     |
+-------------------+-------+
4 rows in set (0.00 sec)

Another parameter offered by the script which seems to be also properly configured is the maximum number of allowed connections (Your max_connections variable seems to be fine). In order to see the maximum number of connections which have been used, we can run the following command:

mysql> show status like 'max_used_connections';
+----------------------+-------+
| Variable_name        | Value |
+----------------------+-------+
| Max_used_connections | 21    |
+----------------------+-------+
1 row in set (0.00 sec)

If we would want to increase the maximum number of allowed connections (100 by default), we could edit the max_connections parameter in the MySQL configuration file:

[root@centos ~]# cat /etc/my.cnf
[mysqld]
...
max_connections=200

wait_timeout = 10
max_connect_errors = 100

Two other parameters to consider are wait_timeout (when this time is exceeded by an idle connection, it will be closed) and max_connect_errors (maximum number of times that a connection can abort or fail - 10 by default).

Another recommendation given by the script with regard to the InnoDB data storage engine, is to set the innodb_buffer_pool_size variable around 60-70% of the total system memory. For the installation of Zabbix, we will allocate 1024 MB because the computer has got 2 GB.

[root@centos ~]# cat /etc/my.cnf
[mysqld]
...
innodb_buffer_pool_size = 1024M

In the case of tables created by the MyISAM engine, the key parameter is key_buffer_size, which is already correctly adjusted (Your key_buffer_size seems to be fine) because the Zabbix database does not use this kind of tables.

For databases which utilize this sort of search engine with its tables, it is recommended to set this parameter around 25% of the total system memory.

Another way to adjust it is consulting the key_read_requests and key_reads values. The first of them indicates the number of requests which have used the index (memory) and the second, the number of requests made directly from the disk. Then it is clear that is interesting that key_reads is as low as possible and key_read_requests as high.

mysql> show status like '%key_read%';
+-------------------+--------+
| Variable_name     | Value  |
+-------------------+--------+
| Key_read_requests | 242148 |
| Key_reads         | 35618  |
+-------------------+--------+
2 rows in set (0.00 sec)

An optimal ratio should be around 1% (for each disk request made, 100 are performed from the buffer in memory).

If we want to fit this variable, we have to set its value into the my.cnf file.

[root@centos ~]# cat /etc/my.cnf
[mysqld]
...
key_buffer_size = 32M


Sep 27, 2010

MySQL optimization (I)

When MySQL is installed by a software packages manager such as yum or aptitude, we get instantly a valid database server ready to work.

It turns out that installation is performed with a series of settings applied by default, which are not the most optimal for our system in most cases, since there are many more variables (memory, CPU, other services configured, etc.) that we have to consider.

Therefore, it is the best that once the databases have been created, to leave a margin large enough time (for example a couple of days) to make the system stable and to be able to acquire its real work load.

In that moment , we can apply any sort of MySQL optimization or tunning tool, such as MySQL Performance Tuning Primer Script or MySQLTuner.

Then we are going to use the first tool on a Zabbix 1.8.1 installation, utilizing CentOS 5.4 64 bits with a MySQL 5.0.77 database.

[root@centos ~]# ./tuning-primer.sh

Using login values from ~/.my.cnf
- INITIAL LOGIN ATTEMPT FAILED -
Testing for stored webmin passwords:
None Found
Could not auto detect login info!
Found Sockets: /var/lib/mysql/mysql.sock
Using: /var/lib/mysql/mysql.sock
Would you like to provide a different socket?: [y/N]
Do you have your login handy ? [y/N] : y
User: root
Password:

Would you like me to create a ~/.my.cnf file for you? [y/N] :

-- MYSQL PERFORMANCE TUNING PRIMER --
     - By: Matthew Montgomery -

MySQL Version 5.0.77 x86_64

Uptime = 2 days 0 hrs 53 min 41 sec
Avg. qps = 19
Total Questions = 3375129
Threads Connected = 15

Server has been running for over 48hrs.
It should be safe to follow these recommendations

To find out more information on how each of these
runtime variables effects performance visit:
http://dev.mysql.com/doc/refman/5.0/en/server-system-variables.html
Visit http://www.mysql.com/products/enterprise/advisors.html
for info about MySQL's Enterprise Monitoring and Advisory Service

SLOW QUERIES
The slow query log is NOT enabled.
Current long_query_time = 10 sec.
You have 0 out of 3375150 that take longer than 10 sec. to complete
Your long_query_time seems to be fine

BINARY UPDATE LOG
The binary update log is NOT enabled.
You will not be able to do point in time recovery
See http://dev.mysql.com/doc/refman/5.0/en/point-in-time-recovery.html

WORKER THREADS
Current thread_cache_size = 0
Current threads_cached = 0
Current threads_per_sec = 1
Historic threads_per_sec = 0
Your thread_cache_size is fine

MAX CONNECTIONS
Current max_connections = 100
Current threads_connected = 15
Historic max_used_connections = 21
The number of used connections is 21% of the configured maximum.
Your max_connections variable seems to be fine.

INNODB STATUS
Current InnoDB index space = 112 M
Current InnoDB data space = 240 M
Current InnoDB buffer pool free = 0 %
Current innodb_buffer_pool_size = 8 M
Depending on how much space your innodb indexes take up it may be safe
to increase this value to up to 2 / 3 of total system memory

MEMORY USAGE
Max Memory Ever Allocated : 75 M
Configured Max Per-thread Buffers : 274 M
Configured Max Global Buffers : 17 M
Configured Max Memory Limit : 292 M
Physical Memory : 1.96 G
Max memory limit seem to be within acceptable norms

KEY BUFFER
Current MyISAM index space = 71 K
Current key_buffer_size = 7 M
Key cache miss rate is 1 : 6
Key buffer free ratio = 81 %
Your key_buffer_size seems to be fine

QUERY CACHE
Query cache is supported but not enabled
Perhaps you should set the query_cache_size

SORT OPERATIONS
Current sort_buffer_size = 2 M
Current read_rnd_buffer_size = 256 K
Sort buffer seems to be fine

JOINS
Current join_buffer_size = 132.00 K
You have had 4 queries where a join could not use an index properly
You should enable "log-queries-not-using-indexes"
Then look for non indexed joins in the slow query log.
If you are unable to optimize your queries you may want to increase your
join_buffer_size to accommodate larger joins in one pass.

Note! This script will still suggest raising the join_buffer_size when
ANY joins not using indexes are found.

OPEN FILES LIMIT
Current open_files_limit = 1024 files
The open_files_limit should typically be set to at least 2x-3x
that of table_cache if you have heavy MyISAM usage.
Your open_files_limit value seems to be fine

TABLE CACHE
Current table_cache value = 64 tables
You have a total of 105 tables
You have 64 open tables.
Current table_cache hit rate is 0%
, while 100% of your table cache is in use
You should probably increase your table_cache

TEMP TABLES
Current max_heap_table_size = 16 M
Current tmp_table_size = 32 M
Of 85195 temp tables, 31% were created on disk
Effective in-memory tmp_table_size is limited to max_heap_table_size.
Perhaps you should increase your tmp_table_size and/or max_heap_table_size
to reduce the number of disk-based temporary tables
Note! BLOB and TEXT columns are not allow in memory tables.
If you are using these columns raising these values might not impact your
ratio of on disk temp tables.

TABLE SCANS
Current read_buffer_size = 128 K
Current table scan ratio = 0 : 1
read_buffer_size seems to be fine

TABLE LOCKING
Current Lock Wait ratio = 0 : 3375450
Your table locking seems to be fine

When we run the second tool, we pick up the following information:

[root@centos ~]# ./mysqltuner.pl

>>  MySQLTuner 1.0.1 - Major Hayden <major@mhtx.net>
>>  Bug reports, feature requests, and downloads at http://mysqltuner.com/
>>  Run with '--help' for additional options and output filtering
Please enter your MySQL administrative login: root
Please enter your MySQL administrative password:

-------- General Statistics --------------------------------------------------
[--] Skipped version check for MySQLTuner script
[OK] Currently running supported MySQL version 5.0.77
[OK] Operating on 64-bit architecture

-------- Storage Engine Statistics -------------------------------------------
[--] Status: -Archive +BDB -Federated +InnoDB -ISAM -NDBCluster
[--] Data in InnoDB tables: 240M (Tables: 88)
[!!] BDB is enabled but isn't being used
[OK] Total fragmented tables: 0

-------- Performance Metrics -------------------------------------------------
[--] Up for: 2d 0h 56m 0s (3M q [19.168 qps], 23K conn, TX: 530M, RX: 331M)
[--] Reads / Writes: 69% / 31%
[--] Total buffers: 34.0M global + 2.7M per thread (100 max threads)
[OK] Maximum possible memory usage: 309.0M (15% of installed RAM)
[OK] Slow queries: 0% (0/3M)
[OK] Highest usage of available connections: 21% (21/100)
[OK] Key buffer size / total MyISAM indexes: 8.0M/67.0K
[!!] Key buffer hit rate: 85.3% (239K cached / 35K reads)
[!!] Query cache is disabled
[OK] Sorts requiring temporary tables: 0% (0 temp sorts / 14K sorts)
[!!] Temporary tables created on disk: 31% (38K on disk / 123K total)
[!!] Thread cache is disabled
[!!] Table cache hit rate: 0% (64 open / 9K opened)
[OK] Open file limit used: 0% (0/1K)
[OK] Table locks acquired immediately: 100% (3M immediate / 3M locks)
[!!] InnoDB data size / buffer pool: 240.7M/8.0M

-------- Recommendations -----------------------------------------------------
General recommendations:
Add skip-bdb to MySQL configuration to disable BDB
Enable the slow query log to troubleshoot bad queries
When making adjustments, make tmp_table_size/max_heap_table_size equal
Reduce your SELECT DISTINCT queries without LIMIT clauses
Set thread_cache_size to 4 as a starting value
Increase table_cache gradually to avoid file descriptor limits
Variables to adjust:
query_cache_size (>= 8M)
tmp_table_size (> 32M)
max_heap_table_size (> 16M)
thread_cache_size (start at 4)
table_cache (> 64)
innodb_buffer_pool_size (>= 240M)

In the next two article, we will see how to fit these values.


Sep 19, 2010

IT security audits

At the moment to audit a computer system, there are three kinds of audits:

Black box audit. It is the sort of audit most difficult of all; it is carried out from the external network of the architecture to be audited, for instance from Internet. The auditor has got little data (usually, public IP addresses or URLs) and he has to use different techniques to attempt to access the system (Google hacking, social engeneering, scanning open ports and analysis of vulnerabilities, penetration tests, etc.)

This type of audit does not assure that a system will be absolutely secure, since there can be services which are properly protected through right perimeter security policies.

Grey box audit. In this sort of audits, the analysis is performed from the own internal network of the infrastructure to be audited. Unlike the black box audit, the auditor is connected to the internal network (he has not already to worry about evading the external network elements - routers, firewalls, security appliances, etc.) and therefore, he will have greater visibility about the differents devices which can be found inside.

Through various hacking techniques (inventory of equipments and services, internal traffic captures, analysis of vulnerabilities, intrusion tests, etc.), the auditor's goal will be obtaining administrative privileges of the most of the infrastructure elements.

White box audit. This type of audit is also made from the own network to be audited, but in contradistinction to the previous, the auditor will have credentials of the systems (normal user and administrator accounts), as well as the more detailed information of the architecture (it should be provided by the audited organization).

Therefore, the target of this type of audit will be looking into the configurations of the different services and systems, in order to look for possible anomalous situations (not updated software, weak passwords, malware infections, etc.) which depend on their own local security architecture. To do this, the auditor will be able to have tools provided by the own vendors, as well as other applications available in the market, which always try to realize a full system check.

From all this can be concluded that the three kinds of security audits which have been explained are complementary each other, because although the black box audit provides us a more generic view of how a supposed hacker would act, we must know that this person will not stop when he has achieved access for example to the web server, but that he will also attempt to gain access to the rest of systems.

White box audits supply us a more detailed information about the local security of the different devices, and they are usually the most requested audits by the companies, since they can prevent for example that the own or former employees of the company can make malicious tasks.

And why do companies often require white box audits and no grey box? The response is very simple: it is a time question that the auditor who is connected to the internal network of the company can get users credentials capturing network traffic. So just what is wanted is a time saving for both parts.

And finally it is also important to remind that securing an infrastructure does not mean that you have to set many security elements at the input point of Internet, but that it will be necessary to apply correct local security policies (network segmentation, strong passwords, antivirus, security patches, etc.).


Sep 13, 2010

System monitoring with top

Probably the most important tool for any Linux systems administrator is top, which has got an interface that provides a real time view of the main events that are happening in the system, such as CPU consumption, memory, processes state, etc.

[root@centos ~]# top
top - 11:29:56 up 53 min,  1 user,  load average: 0.16, 0.05, 0.05
Tasks: 136 total,   1 running, 135 sleeping,   0 stopped,   0 zombie
Cpu(s):  0.5%us,  0.6%sy,  0.0%ni, 98.2%id,  0.5%wa,  0.0%hi,  0.1%si,  0.0%st
Mem:   2059768k total,   352036k used,  1707732k free,    21248k buffers
Swap:  4095992k total,        0k used,  4095992k free,   207520k cached

PID USER      PR  NI  VIRT  RES  SHR S %CPU %MEM    TIME+  COMMAND
3057 root      15   0 12732 1004  716 R  2.0  0.0   0:00.01 top
1 root      15   0 10344  672  560 S  0.0  0.0   0:00.45 init
2 root      RT  -5     0    0    0 S  0.0  0.0   0:00.00 migration/0
3 root      34  19     0    0    0 S  0.0  0.0   0:00.00 ksoftirqd/0
4 root      RT  -5     0    0    0 S  0.0  0.0   0:00.00 watchdog/0
5 root      10  -5     0    0    0 S  0.0  0.0   0:04.19 events/0
6 root      10  -5     0    0    0 S  0.0  0.0   0:00.00 khelper
23 root      10  -5     0    0    0 S  0.0  0.0   0:00.00 kthread
27 root      10  -5     0    0    0 S  0.0  0.0   0:00.00 kblockd/0
28 root      20  -5     0    0    0 S  0.0  0.0   0:00.00 kacpid
85 root      20  -5     0    0    0 S  0.0  0.0   0:00.00 cqueue/0
88 root      20  -5     0    0    0 S  0.0  0.0   0:00.00 khubd
90 root      10  -5     0    0    0 S  0.0  0.0   0:00.00 kseriod
154 root      25   0     0    0    0 S  0.0  0.0   0:00.00 pdflush
155 root      15   0     0    0    0 S  0.0  0.0   0:00.03 pdflush
156 root      20  -5     0    0    0 S  0.0  0.0   0:00.00 kswapd0
157 root      20  -5     0    0    0 S  0.0  0.0   0:00.00 aio/0
298 root      11  -5     0    0    0 S  0.0  0.0   0:00.00 kpsmoused
...

We have a first line where the two most important data are the time that the machine is on (11:29:56 up) and the average number of system processes (load average) which have been waiting for any system resource (CPU, disk access, network, etc.) during the last 1, 5 and 15 minutes.

Then there is a data block where are showed the overall features of the system:

Tasks indicates the processes number which are up, where some of them will be able to be in running, sleeping, stopped or zombie state.

Cpu(s) shows the CPU use, by both the user (%us) and the system (%sy), as well as the percentage of CPU idle (%id).

Mem indicates the distribution which is being done of the RAM memory, offering the total amount available (total), the memory currently in use (used), the free memory (free), the buffers used (buffers) and within the total memory used, how much is cached (cached).

Swap shows the distribution of swap memory, providing the total amount available (total) and the part which is being used (used).

The other block of information presented by top is a set of columns with information about each process.

  • PID: process ID number.

  • USER: user name who has run the process.

  • PR: process priority.

  • NI: process priority change.

  • VIRT: amount of virtual memory for process (including all code, data and shared libraries - if you have N instances of the same program running at the same time, the context of the application will be only once in memory). VIRT = SWAP + RES.

  • RES: total physical memory (RAM) used by the process.

  • SHR: amount of memory that can be shared with other processes.

  • S: process status; D (sleeping and interruptible), S (sleeping), T (stopped) and Z (zombie).

  • %CPU: percentage of CPU usage.

  • %MEM: percentage of physical memory usage.

  • TIME+: total CPU time used by the process.

  • COMMAND: application which has run the process.

There are other fields associated with the tasks which are not displayed by default by top. If you want to view them, first you must press the 'f' key in order to see all available fields, and then press the key associated with the field to be added (e.g. 'p' key for SWAP).

Also say that the column values displayed by top can be ordered according to the memory (shift + m), PID (shift + n), CPU (shift + p) and the total CPU time used by the process (shift + t).

Finally also say that sometimes we can get that almost all physical memory is in use, but to sort the processes by memory, do not add the total amount of memory used. At this moment we will must look at the cached field, since in this way we will be able to see that the operating system is caching part of that memory, and the fact that a system caches memory is really the optimal situation.


Sep 6, 2010

Google hacking

Google stores a large amount of information in their databases related with all the websites indexed on Internet. We can consult those indexes at a given time to localize specific information.

The term Google hacking is refered to the fact of using certain searches, as well known as queries, to detect or find different types of information, such as hidden directories, sensitive data, passwords, credit card numbers, vulnerabilities, exploits, etc. These actions can be made through Google search or other applications based on this search engine.

For example, to locate websites that offer directory listings we can use the next query:

intitle:"index.of"

If we are examining a concrete website to look at whether it has got some hidden directory, we can also add the URL:

intitle:"index.of" site:redes-privadas-virtuales.blogspot.com

Handle these techniques correctly is very important to develop a good security audit, since this form we can find and revise security breaches that can be used by an attacker.

intitle:"index.of" (inurl:temp | inurl:tmp | inurl:private | inurl:admin)

intext:(password | passcode | pass) intext:(username | userid | user)

allinurl:”exchange/logon.asp”

filetype:c exploit

“Microsoft-IIS/5.0 server at”

We have been able to view that Google hacking is not an intrusive hacking method, since we can gather sensitive information without sending a single TCP packet against the target site.

There are lots of books written about the topic, and there is also a website named Google Hacking Database which contains many examples.

Aug 30, 2010

SNMP basic commands

In this article we are going to see the main SNMP commands that are provided by the net-snmp and net-snmp-utils packages.

The MIBs used by these tools normally reside in the /usr/share/snmp/mibs/ directory. Therefore, if we have ever to install new MIBs (e.g. for a VMware ESXi) we will have to leave them into that directory.

[root@centos ~]# ls -l /usr/share/snmp/mibs/
total 2364
...
-r--r--r-- 1 root root   8259 feb 16 12:09 SNMPv2-CONF.mib
-rw-r--r-- 1 root root   8263 feb 16 11:19 SNMPv2-CONF.txt
-r--r--r-- 1 root root  31588 feb 16 12:09 SNMPv2-MIB.mib
-rw-r--r-- 1 root root  29305 feb 16 11:19 SNMPv2-MIB.txt


snmpget

The snmpget command provides information about a specific OID.

For instance, to request the name of the device (system.sysName OID, belonging to the SNMPv2-MIB module) we will run the following order:

[root@centos ~]# snmpget -v 2c -c centos-community 192.168.1.10 SNMPv2-MIB::system.sysName.0
SNMPv2-MIB::sysName.0 = STRING: centos

We can also use abbreviations as follows:

[root@centos ~]# snmpget -v 2c -c centos-community 192.168.1.10 system.sysName.0
SNMPv2-MIB::sysName.0 = STRING: centos

[root@centos ~]# snmpget -v 2c -c centos-community 192.168.1.10 sysName.0
SNMPv2-MIB::sysName.0 = STRING: centos

Also say that multiple queries and use the OID in numeric format can be done.

[root@centos ~]# snmpget -v 2c -c centos-community 192.168.1.10 sysName.0 sysUpTime.0
SNMPv2-MIB::sysName.0 = STRING: centos
DISMAN-EVENT-MIB::sysUpTimeInstance = Timeticks: (69808) 0:11:38

[root@centos ~]# snmpget -v 2c -c centos-community 192.168.1.10 .1.3.6.1.2.1.1.5.0
SNMPv2-MIB::sysName.0 = STRING: centos


snmptranslate

The snmptranslate command allows to make translations of OIDs from numeric format to variable and vice versa.

[root@centos ~]# snmptranslate .1.3.6.1.2.1.2.2.1.4.2
IF-MIB::ifMtu.2

[root@centos ~]# snmptranslate -On IF-MIB::ifMtu.2
.1.3.6.1.2.1.2.2.1.4.2

In order to get the complete OID, we must use the -Of parameter.

[root@centos ~]# snmptranslate -Of IF-MIB::ifMtu.2
.iso.org.dod.internet.mgmt.mib-2.interfaces.ifTable.ifEntry

For example it can happend that we don't remember the complete OID name. In this case, the -Ib parameter will provide us the best match.

[root@centos ~]# snmptranslate -Ib 'i*tu'
IF-MIB::ifMtu

But if we want to get all the matches that fit with the selected pattern, we will use the -TB option.

[root@centos ~]# snmptranslate -TB 'sys.*ime'
SNMPv2-MIB::sysORUpTime
SNMPv2-MIB::sysUpTime
DISMAN-EVENT-MIB::sysUpTimeInstance
IP-MIB::ipSystemStatsDiscontinuityTime

Finally, also say that the snmptranslate command is very useful to show the entire OIDs tree or all branches that hang of a particular OID.

[root@centos ~]# snmptranslate -Tp -IR | more
+--iso(1)                    
|
+--org(3)
|
+--dod(6)
|
+--internet(1)
...

[root@centos ~]# snmptranslate -Tp -IR system
+--system(1)
|
+-- -R-- String    sysDescr(1)
|        Textual Convention: DisplayString
|        Size: 0..255
+-- -R-- ObjID     sysObjectID(2)
+-- -R-- TimeTicks sysUpTime(3)
|  |
|  +--sysUpTimeInstance(0)
...


snmpwalk

The snmpwalk command is utilized to perform a series of followed GETNEXTS instructions, and thus to obtain for example all the values of a specific branch.

[root@centos ~]# snmpwalk -v 2c -c centos-community 192.168.1.10 system
SNMPv2-MIB::sysDescr.0 = STRING: Linux server 2.6.18-164.11.1.el5 #1 SMP Wed Jan 20 07:32:21 EST 2010 x86_64
SNMPv2-MIB::sysObjectID.0 = OID: NET-SNMP-MIB::netSnmpAgentOIDs.10
DISMAN-EVENT-MIB::sysUpTimeInstance = Timeticks: (342908) 0:57:09.08
SNMPv2-MIB::sysContact.0 = STRING: Root  (configure /etc/snmp/snmp.local.conf)
SNMPv2-MIB::sysName.0 = STRING: centos
...


Aug 23, 2010

VMware vSphere (ESXi): There is no more space for virtual disk

El título de este artículo refleja un error que nos puede ocurrir al administrar un VMware vSphere si no tenemos en cuenta ciertos detalles relacionados con la estructura de ficheros que emplea una máquina virtual.

Concretamente el mensaje de error al que me refiero es el siguiente: msg.hbacommon.outofspace: There is no more space for virtual disk xxxxxx. You may be able to continue this session by freeing disk space on the relevant partition, and clicking Retry. Otherwise, click Abort to terminate this session.


El problema es muy sencillo: alguna de nuestras máquinas virtuales ha ido creciendo de tamaño de tal manera que se ha agotado el espacio de nuestro datastore.

Vamos a poner un ejemplo para entender el asunto: supongamos que tenemos un datastore con un tamaño de 32 GB, y dentro de él creamos una máquina virtual a la que le asignamos 2 GB de memoria RAM y un disco virtual de 16 GB (vmdk).

Ya de primeras podremos pensar que nos quedan libres 16 GB, y estaremos en lo cierto. Pero en el momento en el que arranquemos dicha máquina virtual, se creará un nuevo archivo temporal con extensión vswp (fichero de swap creado por vSphere que coincidirá en tamaño con la cantidad de memoria RAM asignada) dentro del directorio donde resida la máquina virtual. El tamaño de dicho archivo será de 2 GB, luego ya no nos quedarán 16 GB libres, sino 14 GB.

Y el tema no se acaba aquí. Si en algún momento creamos un snapshot, el fichero vmdk que alberga la máquina virtual pasará a ser de sólo lectura (se congela), y se creará un nuevo archivo vmdk donde se irán guardando los cambios (incrementales) que afecten al vmdk congelado. Por lo tanto al hacer el snapshot, nos encontramos ante un nuevo archivo que podrá ir creciendo de forma dinámica en el tiempo.


Luego si en un momento dado el snapshot de esa máquina virtual (o de otras) aumenta de tal manera que nos quedemos sin espacio libre en el datastore, la máquina virtual que crezca dinámicamente sufrirá un crash y tendremos un mensaje como el de la imagen.

Por todo esto siempre he pensado que el snapshot debe de ser una herramienta que se utilice de forma temporal, por ejemplo cuando vayamos a actualizar un sistema operativo o aplicación. Transcurrido un tiempo prudencial, deberemos eliminarlo.

El rendimiento de una máquina virtual no puede ser el mismo si se trabaja con un disco virtual estático que si se hace sobre otro que varía su tamaño de forma dinámica.

Aug 16, 2010

Instalación y configuración de SNMP

En el presente artículo vamos a ver cómo configurar el servicio SNMP en una distribución CentOS 5.5 de 64 bits.

Lo primero que haremos será instalar los paquetes necesarios en el sistema:
[root@centos ~]# yum install net-snmp net-snmp-utils

A continuación definiremos las ACL (Access Control Lists) o listas de control de acceso dentro del fichero de configuración del demonio (snmpd.conf), a través de las cuáles indicaremos quién podrá conectarse al servicio SNMP y con qué permisos.

Básicamente vamos a crear dos ACLs, local y mynetwork, ambas pertenecientes a la comunidad centos-community. La primera de ellas tendrá permisos de lectura y escritura sobre las ramas de OIDs, y la segunda de ellas, únicamente permisos de lectura.

[root@centos ~]# cat /etc/snmp/snmpd.conf
...
com2sec local 127.0.0.1/32 centos-community
com2sec mynetwork 192.168.1.0/8 centos-community

A continuación crearemos dos grupos, uno de sólo lectura (MyROGroup) y otro de lectura/escritura (MyRWGroup) que podrán utilizar cualquier versión del protocolo SNMP (any).

[root@centos ~]# cat /etc/snmp/snmpd.conf
...
group MyROGroup any mynetwork
group MyRWGroup any local

access MyROGroup "" any noauth exact all none none
access MyRWGroup "" any noauth exact all all all

Y por último, definiremos las ramas que permitiremos visualizar.

[root@centos ~]# cat /etc/snmp/snmpd.conf
...
view all included .1

Ahora sólo tendremos que reiniciar el servicio y hacer que éste se inicie automáticamente cada vez que arranque el sistema.

[root@centos ~]# service snmpd restart

[root@centos ~]# chkconfig snmpd on

Para comprobar que todo funciona correctamente, podremos hacer la prueba de listar la estructura de system.

[root@centos ~]# snmpwalk -v 2c localhost -c centos-community system